[EXP] Actively Exploited Apache ActiveMQ RCE (CVE-2026-34197)

Report Type: Exploitation Report (EXP)
Threat Category:
Remote Code Execution (RCE) via Management Interface Abuse
Assessment Date:
April 16, 2026
Primary Impact Domain:
System Compromise
Service Disruption
Secondary Impact Domains:
Lateral Movement
Data Exposure
Operational Instability
Affected Asset Class:
Middleware / Messaging Infrastructure (Apache ActiveMQ Broker)
Threat Objective Classification:
Initial Access
Execution
Lateral Movement
Impact

BLUF
The organization faces a critical business risk from remote code execution against a core messaging system that can lead to system compromise and downstream operational disruption. The issue is caused by exposed or insufficiently restricted management interfaces that permit unauthorized control of broker functionality. Active exploitation shows attackers can reliably achieve execution with minimal barriers and limited observable indicators. Immediate executive action is required to restrict access, enforce monitoring, and prioritize containment of exposed systems.
S3 — Why This Matters Now
• Exploitation is active and aligned to a repeatable attack method
• Attackers require minimal effort when management interfaces are exposed
• Compromise can occur without traditional malware or file-based indicators
• Detection capability varies significantly based on monitoring maturity
• Affected systems commonly connect to multiple critical business services
S4 — Key Judgments
• Exposure of management interfaces directly enables remote system compromise
• Successful attacks can occur with minimal observable activity
• Detection capability is determined by monitoring coverage, not attack complexity
• Affected systems create a pathway to broader enterprise impact
• Risk severity is driven by exposure and visibility gaps
S5 — Executive Risk Summary
Business Risk
• Compromise of a central messaging platform enabling disruption and downstream system access
• Potential data exposure and service instability across dependent applications
Technical Cause
• Insecure exposure or weak restriction of broker management functionality
• Ability to execute privileged operations remotely through management interfaces
Threat Posture
• Active exploitation with proven execution methods
• Low barrier to entry when exposed
• High likelihood of undetected compromise in low-visibility environments
Executive Decision Requirement
• Restrict or eliminate external access to management interfaces
• Validate and enforce monitoring across network and host layers
• Prioritize remediation and containment of exposed systems
S6 — Executive Cost Summary
Low Impact Scenario
• Isolated exposure with strong access controls and rapid detection
• Minimal operational disruption and no material lateral movement
• Estimated Cost: $50K – $250K
Moderate Impact Scenario (Most Likely)
• Partial exposure of management interfaces within internal or limited external scope
• Detection delay due to incomplete monitoring of management activity or outbound behavior
• Limited lateral movement into connected application or middleware systems without full enterprise compromise
• Estimated Cost: $250K – $1.2M
High Impact Scenario
• Broad or unmanaged exposure of management interfaces to untrusted networks
• Delayed detection combined with sustained attacker access
• Lateral movement into critical systems, resulting in operational disruption and potential data exposure
• Estimated Cost: $1.2M – $5M+
S6A — Key Cost Drivers
• Degree of exposure of management interfaces to internal or external networks
• Time to detection driven by availability of monitoring across network and host layers
• Extent of system connectivity from the affected broker to critical services
• Sensitivity and regulatory classification of accessible data and systems
• Ability of attacker to maintain access and expand beyond initial compromise
Scenario Justification
The Moderate scenario is assessed as most likely because many environments expose management functionality within internal networks or partially restrict external access while lacking complete monitoring coverage. This creates conditions where exploitation is feasible, detection is delayed, and limited expansion into connected systems occurs without immediate full-scale compromise.
S6B — Compliance and Risk Context
Compliance Exposure Indicator
• Elevated where affected systems support regulated data, financial processing, or critical operations
Risk Register Entry
Risk Title
ActiveMQ Remote Code Execution via Management Interface Exposure
Risk Description
Exposed or weakly controlled management interfaces allow unauthorized execution of system-level operations, leading to potential full system compromise and downstream impact.
Likelihood
High
Impact
High
Risk Rating
Critical
Annualized Risk Exposure
$400K – $1.5M (aligned to most likely moderate impact scenario)
S7 — Risk Drivers
• External or internal exposure of management interfaces
• Insufficient access control or authentication enforcement
• Limited monitoring of management interface activity
• Lack of visibility into system-level execution behavior
• High connectivity between broker systems and critical internal services
S8 — Bottom Line for Executives
This is a high-impact, actively exploited risk affecting a central system that connects multiple business services. The attack can succeed with limited observable indicators, increasing the likelihood of delayed detection. Organizations with incomplete monitoring are at elevated risk of operational disruption and downstream compromise. Immediate reduction of exposure and improved visibility are required to lower risk.
S9 — Board-Level Takeaway
A critical internal system can be remotely controlled with limited visibility, creating a high likelihood of unnoticed compromise and business disruption. Immediate action is required to reduce exposure and strengthen monitoring before this risk results in material impact.

Figure 2
S10 — Threat Overview
Apache ActiveMQ is a widely deployed messaging broker that functions as a central integration layer across enterprise systems. The threat involves exploitation of broker management functionality to achieve remote code execution. The weakness lies in the ability to invoke privileged broker operations through exposed or insufficiently restricted interfaces. This creates a condition where external interaction can directly influence system behavior and lead to compromise.
S11 — Threat Classification and Type
Threat Type
• Remote Code Execution (RCE)
Threat Sub-Type
• Management Interface Abuse
• Application Layer Exploitation
• Remote Service Abuse
Operational Classification
• Active Exploitation
• External-to-Internal Compromise Vector
Primary Function
• Execute code within broker context
• Enable access to connected internal systems
S12 — Campaign or Activity Overview
Observed activity reflects active exploitation of exposed broker management interfaces following vulnerability disclosure and inclusion in the Known Exploited Vulnerabilities (KEV) catalog. Publicly available proof-of-concept (POC) code has enabled rapid weaponization, allowing attackers to reliably invoke execution-capable operations without requiring custom exploit development.
The activity is characterized by:
• rapid adoption of publicly available exploitation methods
• consistent and repeatable interaction patterns against exposed endpoints
• automated or semi-automated scanning and exploitation at scale
This indicates a shift from vulnerability discovery to broad operational use, where exploitation is accessible to a wide range of threat actors and can be executed with minimal preparation.
S13 — Targets and Exposure Surface
Primary targets are systems running Apache ActiveMQ with accessible management interfaces.
Exposure surface includes:
• externally exposed management endpoints
• internally accessible interfaces without strict segmentation
• broker systems reachable through misconfigured gateways or proxy paths
Risk increases when:
• access extends beyond dedicated administrative systems
• authentication controls are weak or inconsistently enforced
• management activity is not actively monitored
The attack surface is defined by direct control over broker functionality rather than traditional application entry points.
S14 — Sectors / Countries Affected
Sectors Affected
• Technology and SaaS platforms
• Financial services and transaction processing environments
• Healthcare and regulated industries
• Government and public sector
• Large enterprises with integration-heavy or middleware-centric architectures
Countries Affected
• Global exposure due to widespread deployment of ActiveMQ
• Elevated risk in regions with large enterprise and cloud infrastructure presence
• No geographic limitation observed in exploitation patterns
S15 — Adversary Capability Profiling
Capability Level
• Low to Moderate
• Reduced barrier to entry due to KEV inclusion and availability of public POC
Technical Sophistication
• Low to Moderate
• Does not require advanced exploit development
• Requires basic understanding of exposed interface interaction
Infrastructure Maturity
• Low
• Exploitation achievable with minimal supporting infrastructure
• External infrastructure only required for certain execution paths
Operational Scale
• High
• Supports automated discovery and exploitation across large numbers of targets
• Suitable for both opportunistic and broad targeting activity
Escalation Likelihood
• High
• Compromise of broker system enables access to connected internal services and systems
S16 — Targeting Probability Assessment
Overall Targeting Probability
• High
Targeting Drivers
• Inclusion in KEV catalog indicating confirmed exploitation in the wild
• Availability of public POC enabling rapid and repeatable exploitation
• Exposure of management interfaces across enterprise environments
• Weak or inconsistent access control enforcement
• Limited monitoring of management activity and execution behavior
• Central role of broker systems within interconnected architectures
S17 — MITRE ATT&CK Chain Flow Mapping
Purpose
Represents the ordered progression of attacker activity mapped to MITRE ATT&CK techniques. This sequence is strictly derived from validated exploit mechanics (POC) and confirmed real-world exploitation patterns.
Initial Access
· External interaction with exposed Jolokia management interface
· MITRE ATT&CK:
o T1190 — Exploit Public-Facing Application
Execution
· Invocation of execution-capable MBean operations via Jolokia (type=exec)
· Runtime execution within broker JVM using attacker-controlled parameters
· MITRE ATT&CK:
o T1059 — Command and Scripting Interpreter
o T1106 — Native API
Persistence (Conditional)
· Runtime configuration manipulation via:
o addNetworkConnector
o brokerConfig
· May persist until broker restart or reconfiguration
· MITRE ATT&CK:
o T1505 — Server Software Component
Command and Control (Conditional)
· Broker-initiated outbound communication to retrieve remote configuration (e.g., xbean:http://)
· MITRE ATT&CK:
o T1105 — Ingress Tool Transfer
o T1071 — Application Layer Protocol
Lateral Movement
· Use of broker connectivity to interact with internal systems and services
· MITRE ATT&CK:
o T1021 — Remote Services
Impact
· Service disruption via broker manipulation and execution abuse
· MITRE ATT&CK:
o T1499 — Endpoint Denial of Service
S18 — Attack Path Narrative (Signal-Aligned Execution Flow)
The attack begins with interaction against an exposed or accessible management interface on the broker system. Due to publicly available exploitation methods, attackers can reliably initiate this interaction without requiring custom development or advanced preparation.
The attacker submits a request that invokes an execution-capable function, introducing externally controlled parameters into the broker’s operational context.
Upon processing the request, the broker applies the supplied input to its runtime state. This results in behavior that deviates from standard operational patterns, including initiation of actions not typically performed during normal system operation.
In exploit paths requiring external resources, the broker initiates outbound communication to retrieve or process remote data as part of the execution flow. This step enables introduction of attacker-controlled logic without direct file placement on the system.
Execution occurs within the broker’s service context, allowing actions to be performed with existing system privileges. Depending on the execution path, activity may remain within runtime behavior or extend to system-level command execution.
Following execution, the compromised broker may be used to interact with connected systems. This includes initiating additional communication, accessing internal services, or expanding the scope of activity within the environment.
Because exploitation methods are standardized and repeatable, the attack can be executed consistently across multiple targets, increasing the likelihood of broad, parallel compromise where exposure exists.
The attack may complete without generating persistent artifacts, leaving limited observable evidence beyond management interface interaction and any associated outbound communication. In some cases, runtime modifications may persist temporarily until system restart or reconfiguration.
S19 — Attack Chain Risk Amplification Summary
• Central broker role amplifies impact across multiple dependent systems
• Execution within trusted service context increases likelihood of follow-on activity
• Publicly available exploitation methods enable consistent and repeatable attack execution
• Absence of traditional payload delivery reduces early-stage detection visibility
• Optional outbound communication enables flexible execution paths
• Internal exposure reduces reliance on perimeter-based defenses
• Limited artifact generation weakens signature- and file-based controls
• High system interconnectivity enables rapid expansion beyond initial access

Figure 3
S20 — Tactics, Techniques, and Procedures
Purpose
Defines adversary behavior using MITRE ATT&CK-aligned tactics and techniques. This section captures behavior independent of attack flow and includes only techniques directly supported by POC mechanics or required exploit conditions.
Initial Access
· Abuse of exposed Jolokia management interface
· No authentication required in vulnerable configurations
· Techniques:
o T1190 — Exploit Public-Facing Application
Execution
· Invocation of type=exec operations via Jolokia
· Execution within broker JVM context
· Potential OS-level execution via runtime invocation
· Techniques:
o T1059 — Command and Scripting Interpreter
o T1106 — Native API
Persistence (Conditional)
· Runtime configuration manipulation using:
o addNetworkConnector
o brokerConfig
· Techniques:
o T1505 — Server Software Component
Command and Control (Conditional)
· Broker retrieves attacker-controlled resources over HTTP/HTTPS
· Enables remote execution chaining via external configuration
· Techniques:
o T1105 — Ingress Tool Transfer
o T1071 — Application Layer Protocol
Lateral Movement
· Broker leveraged to access and interact with internal systems
· Techniques:
o T1021 — Remote Services
Impact
· Disruption of messaging services and dependent systems
· Techniques:
o T1499 — Endpoint Denial of Service
S20A — Adversary Tradecraft Summary
• Leverages publicly available exploitation methods to eliminate need for custom exploit development
• Uses legitimate management functionality to execute actions without introducing traditional malware
• Operates within runtime context to minimize persistent artifacts
• Adapts execution path based on environment, including optional use of outbound communication
• Exploits access control weaknesses rather than relying on advanced exploitation techniques
• Enables scalable targeting due to repeatable and standardized execution methods
• Leverages centralized system position to extend impact beyond initial compromise
• Maintains low operational footprint to reduce detection likelihood
S21 — Detection Strategy Overview
Detection Philosophy
· Detection is anchored to externally observable Jolokia interactions that result in broker-side write or execution behavior
· Detection explicitly excludes:
o read-only or introspection operations
· Detection assumes:
o attacker may be authenticated
o payload visibility may be absent
· All detection logic must resolve to:
o observable telemetry conditions without reliance on inference for primary detection
Primary Detection Anchors
Anchor 1 — External Write/Exec Invocation
· Observable as:
o HTTP request to Jolokia endpoint
o Operation type indicating:
§ write
§ exec
Required telemetry (explicit extraction sources):
· One of:
o HTTP request body field containing operation type (Jolokia payload)
o Query parameter indicating operation type (if exposed)
o Normalized log field extracted from Jolokia request (e.g., operation or type field)
Degraded mode behavior:
· If none of the above fields are available:
o Anchor 1 is not usable for detection
o Must not be approximated using:
§ request frequency
§ endpoint access alone
Classification:
· Primary detection anchor
· Tier 1 eligible only when operation type is explicitly extracted
Anchor 2 — Broker State Modification
· Observable as:
o Direct evidence of runtime configuration change through:
§ application-layer logs
§ operation-level visibility
Required telemetry:
· Application-layer logging or equivalent operation visibility
Constraint:
· This anchor is:
o non-required for baseline detection coverage
o only used when directly observable
· Must not be inferred from:
o sequence patterns
o timing relationships
Classification:
· Primary anchor when available
· Otherwise excluded from detection logic
Anchor 3 — Broker-Initiated Outbound Activity
· Observable as:
o Outbound connection originating from broker host
o Temporal proximity to inbound Jolokia interaction
Required telemetry:
· Network flow visibility including:
o source host
o destination
o timestamp
Baseline deviation definition (explicit):
· Deviation is defined as:
o outbound destination not previously observed for broker host
o or protocol/service not part of established broker communication patterns
o or timing pattern inconsistent with baseline operation
Constraint:
· Must not be used as standalone detection unless:
o deviation from baseline is established
o or linkage to inbound Jolokia activity is present
Classification:
· Supporting detection anchor
· Tier 2 only
Minimum Viable Detection Path (Explicit)
Detection coverage must remain viable under minimal telemetry using:
· Inbound Jolokia endpoint identification (network-level)
· Outbound broker communication visibility
Under these conditions:
· Detection is limited to:
o Anchor 3 (with baseline deviation or temporal linkage)
Implication:
· Tier 1 detection may not be achievable
· Tier 2 detection remains viable
Exploit Chain Breakpoints
Breakpoint 1 — Execution Trigger
· External write or exec operation via Jolokia
Mapped anchor:
· Anchor 1
Detection classification:
· Tier 1 only when operation visibility exists
Breakpoint 2 — Configuration Injection
· Broker accepts state-changing input
Mapped anchor:
· Anchor 2
Detection classification:
· Tier 1 only when directly observable
· Otherwise not detectable
Breakpoint 3 — Execution / Retrieval
· Broker initiates outbound communication
Mapped anchor:
· Anchor 3
Detection classification:
· Tier 2 only
Detection Prioritization Model
· Tier 1:
o Anchor 1 (operation explicitly extracted)
o Anchor 2 (direct evidence only, when available)
· Tier 2:
o Anchor 3 with:
§ baseline deviation
§ or temporal linkage
· Tier 3:
o service-origin anomalies
Constraint:
· Tier 3 signals:
o must not generate alerts
o must not be used in detection rules
Correlation Strategy
· Detection rules must not require correlation to trigger
· Correlation is limited to:
o temporal linkage between inbound and outbound activity
Constraints:
· Correlation must not:
o create detection conditions
o elevate Tier 2 to Tier 1
Telemetry Requirements
Minimum Viable Telemetry
Inbound:
· destination host and port
· URI path identifying Jolokia endpoint
Outbound:
· source host
· destination
· timestamp
Limitations:
· No operation extraction:
o Anchor 1 unavailable
· No application logs:
o Anchor 2 unavailable
Required for Tier 1 Detection
At least one of:
· operation field extracted from request
· application log confirming write/exec
Preferred Telemetry
· operation-level HTTP visibility
· endpoint process context
· application-layer logs
Detection Design Constraints
· Must not depend on:
o payload inspection
o exact strings
· Must tolerate:
o authenticated execution
o legitimate administrative overlap
· Must enforce:
o separation between read and write operations
Non-Detection Conditions (Explicit)
Detection must not trigger on:
· read-only Jolokia operations
· outbound connections consistent with baseline behavior
· isolated outbound activity without linkage or deviation
· known administrative write operations within baseline
· generic JVM activity without Anchor 1 or Anchor 2
Detection Blind Spots (Explicit)
Detection cannot reliably identify:
· exploitation using:
o write/exec operations when operation visibility is absent
· state modification when:
o application logging is unavailable
· fully in-JVM execution without:
o outbound communication
o or observable side effects
Baseline Requirements
· Identify:
o Jolokia-exposed systems
· Baseline must include:
o normal outbound destinations
o normal management activity patterns
Constraint:
· absence of baseline:
o reduces confidence in Anchor 3
o does not eliminate detection capability
Variant Resilience Requirements
Detection must remain valid under:
· alternate execution paths
· encoded or obfuscated requests
· non-standard protocol usage
· in-JVM execution without child processes
Constraint:
· detection must rely only on:
o invariant behavioral conditions
Operational Detection Model
· Tier 1:
o Anchor 1 or Anchor 2 when directly observable
· Tier 2:
o Anchor 3 with deviation or linkage
· Tier 3:
o service-origin anomalies (investigation only)
S22 — Primary Detection Signals
Primary Detection Signals
· HTTP POST requests to /api/jolokia/ invoking type=exec operations against ActiveMQ broker MBeans
· Invocation of high-risk broker management operations capable of runtime connector or transport manipulation, including:
o addNetworkConnector
o addConnector
· Presence of exploit-defining payload elements within Jolokia requests, including:
o vm://
o brokerConfig=
o xbean:http://
o xbean:https://
· Jolokia-triggered runtime connector creation or modification referencing remote configuration resources
· Correlated sequence of inbound Jolokia execution request followed by outbound broker-initiated remote resource retrieval
Supporting Detection Signals
· Multiple Jolokia exec attempts from the same source within a compressed time window
· Sequential broker MBean modification attempts preceding successful connector creation
· Jolokia access from non-administrative source ranges, internet-originating addresses, or segments not associated with broker administration
· Repeated failed attempts using malformed or alternate connector-related parameters prior to successful execution
· Administrative API interaction patterns inconsistent with expected operational cadence, but only when combined with exploit-specific payload artifacts
Exploit Attempt and Instability Signals
· Failed Jolokia exec requests involving broker connector operations
· Broker exceptions tied to invalid brokerConfig values, malformed vm:// URIs, or failed remote Spring context retrieval
· XML parsing, bean instantiation, transport initialization, or connector startup errors immediately following Jolokia interaction
· Broker instability, service restart, or runtime fault conditions temporally associated with suspicious Jolokia requests
· Partial exploit artifacts where remote resource retrieval or connector initialization begins but execution chain does not complete
Outbound Communication Signals
· ActiveMQ broker initiating outbound HTTP/S connections to retrieve remote XML or Spring configuration resources
· Broker-host DNS resolution for previously unseen external domains immediately following Jolokia interaction
· Outbound connections from broker host to infrastructure not associated with expected messaging, update, or management functions
· Short-interval correlation between inbound Jolokia execution request and outbound broker communication
· Repeated broker-host communication to the same remote resource following failed or successful exploit attempts
Persistence and Post-Exploitation Signals (Conditional)
· Connector behavior continuing after the initial exploit window without corresponding approved administrative activity
· Runtime connector state, transport behavior, or outbound communication patterns inconsistent with known broker configuration
· Follow-on command execution, scripting activity, or service-origin child process behavior from the broker host
· Configuration drift, service restarts, or recurring outbound broker communication suggesting retained malicious state
· Post-exploitation reconnaissance or staging activity originating from the broker host after exploit-correlated execution
Lateral Movement and Expansion Signals (Conditional)
· Broker-initiated communication to internal systems outside approved broker topology or integration paths
· New east-west connection patterns originating from the broker host after exploit-correlated activity
· Broker host used as a relay point for internal service interaction, discovery, or remote access attempts
· Follow-on authentication attempts, service probes, or management-plane access originating from the compromised broker environment
· Expansion activity targeting application, middleware, or database tiers reachable from the broker host
Signal Usage Constraints
· Primary exploit detection is strongest when Jolokia request visibility is available
· Exploit confirmation is substantially strengthened by correlation between inbound execution requests and outbound remote resource retrieval
· Supporting signals are not independently sufficient and must not be promoted to primary indicators without exploit-specific payload evidence
· Conditional post-exploitation and lateral movement signals are environment-dependent and may not appear in all exploit chains
· Legitimate administrative Jolokia usage may overlap with isolated operation names, but legitimate use does not typically include exploit-defining payload combinations such as vm:// with brokerConfig= and remote xbean: retrieval
· Signals degrade sharply in environments lacking web/application logging, outbound network telemetry, or broker-host endpoint coverage
· Detection design must assume attacker adaptation, including malformed request testing, retry behavior, and efforts to blend into legitimate administrative channels
S23 — Telemetry Requirements
Endpoint and Process Execution Telemetry
· EDR or equivalent host telemetry on the ActiveMQ broker host is required to detect:
o Service-origin execution
o Child process spawning from Java or broker service context
o Post-exploitation scripting, tooling, or follow-on command activity
· This telemetry materially improves validation of successful exploitation and downstream activity
· Absence results in loss of execution confirmation, reduced post-exploitation visibility, and inability to validate service-origin behavior
Memory and Execution Telemetry
· JVM-aware telemetry or equivalent execution-layer visibility is required to directly observe:
o In-memory loading of remote Spring XML context
o Bean instantiation or execution without clear file artifacts
· Most operational environments will not have reliable direct visibility at this layer
· Absence means the execution stage is often inferred from correlated signals rather than directly observed
· This gap is material because the exploit chain may complete without spawning obvious child processes or writing durable artifacts
Crash and Fault Telemetry
· Broker logs, JVM exception traces, and service fault telemetry are required to detect:
o Malformed exploit attempts
o Failed connector initialization
o URI parsing errors
o Remote resource load failures
· This telemetry is important for early exploit-attempt visibility, especially when exploitation is unstable or incomplete
· Absence removes a major source of failed-attempt detection and reduces visibility into exploit testing or iterative attacker refinement
File and Persistence Telemetry
· File integrity monitoring, configuration monitoring, or broker-state change visibility is required to detect:
o Configuration drift
o Persistence-related connector changes
o Runtime-to-durable-state transition
o Auxiliary artifacts left by post-exploitation activity
· Direct file artifacts may be limited because this exploit path can operate largely in runtime state
· Absence does not eliminate exploit detection but materially weakens persistence validation and post-event reconstruction
Network and Outbound Communication Telemetry
· Outbound network telemetry is required to detect:
o Remote XML retrieval
o Broker-initiated callback behavior
o Post-exploitation communication to attacker-controlled infrastructure
· DNS telemetry materially strengthens attribution of suspicious remote resource retrieval and domain novelty analysis
· This is a high-value telemetry layer because the exploit chain often depends on broker-host outbound communication
· Absence removes one of the strongest exploit-confirmation paths and significantly weakens detection where application-layer logging is incomplete
Web and Application Telemetry (Conditional Availability)
· Jetty access logs, reverse proxy logs, WAF logs, or explicit Jolokia request logging are required to detect:
o Inbound /api/jolokia/ requests
o type=exec invocation patterns
o Request parameters containing exploit-defining payload elements
· This is the strongest trigger-layer telemetry for exploit-attempt detection
· Availability is conditional because many environments do not log Jolokia requests with sufficient detail
· Absence removes primary exploit-trigger visibility and forces detection to rely on downstream effects
Telemetry Availability Requirements
· Minimum viable detection requires at least one of:
o Detailed Jolokia or web-application request visibility
o Outbound broker-host network visibility
· High-confidence detection requires:
o Jolokia or equivalent inbound request visibility
o Outbound network and DNS telemetry
o Endpoint telemetry on the broker host
· Audit-grade reconstruction is strongest when all three are available and time-correlatable
· Detection strategy must explicitly account for degraded environments rather than assuming full-stack observability
Telemetry Limitations and Gaps
· No Jolokia or application-layer visibility:
o Primary exploit trigger not observable
o Early exploit-attempt detection degraded or lost
· No outbound network telemetry:
o Remote resource retrieval and broker callback behavior not observable
o Successful exploitation more difficult to confirm
· No endpoint telemetry:
o Service-origin execution, post-exploitation behavior, and follow-on activity largely invisible
· No JVM-aware execution visibility:
o In-memory execution and runtime-only behavior inferred rather than directly evidenced
· No crash or fault telemetry:
o Failed-attempt and exploit-testing visibility reduced
· Weak cross-source timestamping or normalization:
o Correlation quality degraded
o High-confidence exploit chain reconstruction weakened
· Telemetry design must assume partial blindness and must not overstate coverage where required sources are absent
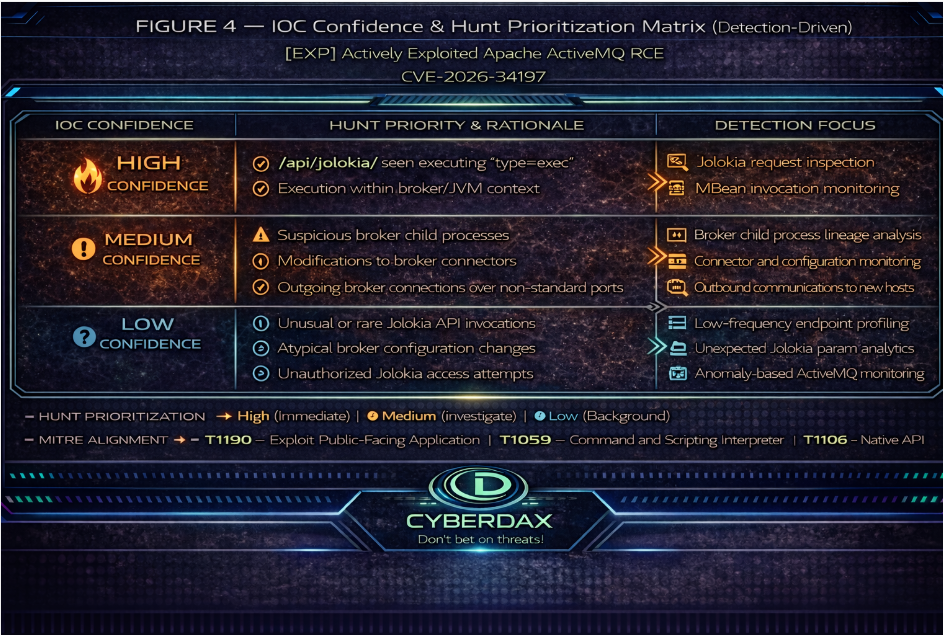
Figure 4
S24 — Detection Opportunities and Gaps
Detected Behaviors
· Jolokia type=exec exploitation attempts involving high-risk broker MBean operations
· Exploit requests containing defining payload artifacts such as vm://, brokerConfig=, and remote xbean: retrieval references
· Correlated inbound execution request followed by outbound broker-host resource retrieval
· Failed exploit attempts that generate broker errors, parsing faults, or remote resource retrieval failures
· Post-exploitation broker-host outbound communication where sufficiently correlated to exploit-stage activity
· Service-origin child process or follow-on execution activity when endpoint telemetry is available
Partially Detected Behaviors
· Single-attempt exploitation with limited logging detail
· Exploitation where outbound communication is short-lived, proxied, or blended into allowed egress
· Runtime connector manipulation where request visibility exists but broker-state change visibility is weak
· Post-exploitation activity that remains service-origin and in-memory without child process creation
· Authenticated misuse where operation names are visible but full exploit payload detail is partially obscured
· Exploit preparation behavior involving malformed or incomplete requests that do not complete the full chain
Hunt Only Behaviors
· Low-noise authenticated Jolokia misuse designed to resemble legitimate administration
· Slow, staged, or distributed exploit attempts separated over time to weaken correlation
· Internal-only exploitation from trusted network segments where source context is less suspicious
· Follow-on misuse of broker access that does not generate distinct exploit-defining payload artifacts
· Post-compromise discovery or internal expansion that blends into normal broker-adjacent operational traffic
· Exploitation paths that suppress obvious instability, avoid retries, and minimize application-layer anomalies
Not Covered Behaviors
· Pure in-memory execution with no application-layer logging, no outbound visibility, and no endpoint telemetry
· Authenticated administrative misuse that omits exploit-defining artifacts and is indistinguishable from legitimate operations in available logs
· Exploitation in environments lacking both request-layer visibility and outbound broker-host telemetry
· Runtime-only malicious behavior that leaves no durable state, no child process lineage, and no correlated network artifacts
· Highly constrained internal exploitation where trusted-source assumptions and absent telemetry eliminate useful discrimination
Telemetry Dependency Summary
· Reliable exploit-attempt detection depends primarily on visibility into Jolokia request activity or equivalent application-layer controls
· Reliable exploit-confirmation depends heavily on outbound broker-host communication telemetry and short-interval correlation with request activity
· Endpoint telemetry materially strengthens confirmation of successful execution and post-exploitation behavior
· JVM-aware telemetry improves direct execution evidence but is not commonly available and cannot be assumed
· Detection quality degrades from high-confidence to partial or hunt-only as request visibility, outbound network telemetry, and endpoint coverage are removed
· Coverage claims must be interpreted according to actual telemetry deployment state, not idealized architecture
Coverage Integrity Statement
· High-confidence detection is achievable for exploit attempts that expose Jolokia execution activity and produce correlated outbound broker-host communication
· High-confidence confirmation is further strengthened where broker-host endpoint telemetry is present
· Partial detection is achievable for exploit attempts that expose only one side of the chain, such as request-layer visibility without outbound confirmation or outbound confirmation without full request detail
· Hunt-only coverage applies where activity blends into legitimate administration, occurs slowly over time, or lacks exploit-defining payload visibility
· Detection coverage is materially degraded in environments lacking detailed Jolokia visibility, outbound network telemetry, or broker-host endpoint coverage
· Detection coverage is not defensibly claimable for in-memory-only or runtime-only abuse that produces no observable request, network, fault, or endpoint artifacts
· No claim of complete exploit coverage is warranted; coverage is strongest for observable exploit-chain execution and weaker for low-artifact authenticated misuse and telemetry-denied environments
S25 Ultra-Tuned Detection Engineering Rules
Suricata
Rule 1 — Jolokia Exec Invocation (Primary Exploit Trigger)
Rule Format
Suricata IDS Rule
Target Behavior
· External entity invokes exec/write operation via the Jolokia endpoint
· Represents direct exploit-trigger behavior tied to broker management abuse
Signal Mapping
· Anchor: External Write/Exec Invocation
· Breakpoint: Execution Trigger
· Tier: Tier 1
Exclusions
· Approved administrative source ranges
· Approved monitoring or automation systems
· Approved maintenance windows
· Known broker-management jump hosts
Engineering Implementation Instructions
· Identify all ActiveMQ brokers exposing /api/jolokia/.
· Confirm Suricata can inspect:
o HTTP method
o URI
o request body
· Enable TLS decryption where management traffic is encrypted.
· Validate that the Jolokia request body preserves the type field after proxies, WAFs, or inspection devices.
· Build allowlists for:
o approved management source IPs
o approved broker administration systems
o approved maintenance infrastructure
· Test against known exploit traffic and benign administrative Jolokia traffic before production deployment.
· Suppress only after validating that the source and activity are expected.
Failure Conditions
· No request-body visibility
· TLS visibility absent
· Request body truncated
· Operation field transformed or removed before inspection
Variant Resilience
· Survives:
o alternate broker MBean targets
o parameter variation after exec invocation
· Degrades when:
o the operation field is not inspectable
DRI: 8.8 / 10
· Strong exploit-trigger anchor
· Low artifact dependence
· Independent and deployable
· Meets Primary Rule Standard
TCR
· Operational TCR: 6.5 / 10
· Full-Telemetry TCR: 9.0 / 10
Detection Logic
alert http any any -> $HOME_NET any (
msg:"ActiveMQ Jolokia exec invocation against management endpoint";
flow:to_server,established;
http.method; content:"POST"; nocase;
http.uri; content:"/api/jolokia/"; nocase;
http.request_body; content:"\"type\":\"exec\""; nocase;
classtype:web-application-attack;
sid:100001;
rev:4;
)
Rule 2 — Jolokia Exec with Connector-Abuse POC Chain (Survivor Rule)
Rule Format
Suricata IDS Rule
Target Behavior
· External entity invokes Jolokia exec activity that matches the confirmed connector-abuse exploit chain
· Detects the POC-aligned form of exploitation where execution intent is combined with broker connector abuse and remote XBean configuration loading
Signal Mapping
· Anchor: External Write/Exec Invocation
· Breakpoint: Execution Trigger
· Tier: Tier 1 survivor / high-confidence exploit-chain detection
Constraints
· This is not a generic payload-artifact rule
· This rule is valid only because it binds:
o exec behavior
o addNetworkConnector operation context
o vm:// transport abuse
o brokerConfig= remote configuration chaining
o xbean:http:// or xbean:https:// retrieval pattern
· Must not be generalized beyond this confirmed exploit-chain form
Exclusions
· Approved internal lab validation traffic
· Explicitly authorized red-team exercises
· Controlled detection engineering test infrastructure
Engineering Implementation Instructions
· Confirm full Jolokia request-body inspection is available.
· Validate that JSON request bodies are preserved without truncation.
· Verify the environment exposes the exact body strings needed for this rule:
o "type":"exec"
o addNetworkConnector
o vm://
o brokerConfig=
o xbean:http:// or xbean:https://
· Add companion encoded-form rules only if testing shows the environment preserves encoded variants consistently.
· Confirm there is no legitimate administrative workflow using:
o addNetworkConnector
o combined with remote brokerConfig=
o and external xbean: retrieval
· If any legitimate overlap exists, allowlist:
o approved source IPs
o approved destination hosts
o approved maintenance windows
· Validate the rule against lab traffic modeled on the public POC before deployment.
Failure Conditions
· No request-body visibility
· Request body transformed or truncated
· Attack chain diverges materially from the confirmed connector-abuse path
· Legitimate admin overlap not baselined
Variant Resilience
· Survives:
o minor variation around the same connector-abuse path
· Weak against:
o materially different exploit paths
o heavy encoding without normalization
o chains that avoid the published remote config sequence
DRI: 7.8 / 10
· Stronger than enrichment-only logic because it requires exploit behavior plus chain-specific mechanics
· More brittle than Rule 1 because it is tied to a narrower confirmed exploit path
· Meets Survivor Rule Standard
TCR
· Operational TCR: 6.0 / 10
· Full-Telemetry TCR: 8.6 / 10
Detection Logic
alert http any any -> $HOME_NET any (
msg:"ActiveMQ Jolokia exec with connector-abuse exploit chain parameters";
flow:to_server,established;
http.method; content:"POST"; nocase;
http.uri; content:"/api/jolokia/"; nocase;
http.request_body; content:"\"type\":\"exec\""; nocase;
http.request_body; content:"addNetworkConnector"; nocase;
http.request_body; content:"vm://"; nocase;
http.request_body; content:"brokerConfig="; nocase;
pcre:"/xbean\s*:\s*https?:\/\//Ri";
classtype:web-application-attack;
sid:100002;
rev:3;
)
SentinelOne
Rule 1 — ActiveMQ Broker Context Spawning Command Interpreter or Shell
Rule Format
SentinelOne Deep Visibility
Target Behavior
· ActiveMQ broker execution context spawns a command interpreter or shell
· Represents OS-level code execution consistent with successful exploitation
Signal Mapping
· Anchor: Execution Outcome
· Breakpoint: Code Execution
· Tier: Tier 1
Constraints
· Must be restricted to confirmed ActiveMQ broker context
· Must not be applied to generic Java processes
Exclusions
· Approved broker maintenance scripts
· Approved administrative automation
· Authorized testing or red-team activity
Engineering Implementation Instructions
· Identify broker execution context using at least two of:
o broker host list
o installation path
o command line containing activemq
o service account
o wrapper process identity
· Validate process lineage fields:
o parent process name
o parent process path
o parent command line
o parent user
o child process name
o child command line
· Determine whether broker runs as:
o direct java / java.exe
o service wrapper
o Tanuki wrapper or equivalent
· Build a 30-day baseline of broker-origin child processes
· Confirm broker does not normally spawn:
o cmd.exe, powershell.exe, pwsh.exe, sh, bash
· Allowlist any verified legitimate exceptions
· Restrict rule to broker hosts only
· Validate using controlled execution testing
Failure Conditions
· Broker context not accurately identified
· Legitimate child processes not baselined
· Execution occurs fully in-memory with no process spawn
Variant Resilience
· Survives exploit-chain variation and payload variation
· Strong against OS-level execution outcomes
· Weak against in-memory-only execution
DRI: 8.9 / 10
TCR
· Operational: 8.3 / 10
· Full-Telemetry: 9.2 / 10
Detection Logic
EventType = "Process Creation"
AND EndpointName IN (ACTIVEMQ_BROKER_HOSTS)
AND ParentProcessName IN ("java.exe","java","wrapper.exe","wrapper")
AND (
ParentProcessPath CONTAINS ACTIVEMQ_INSTALL_PATH
OR ParentCommandLine CONTAINS "activemq"
OR ParentUser IN (ACTIVEMQ_SERVICE_ACCOUNTS)
)
AND ProcessName IN (
"cmd.exe","powershell.exe","pwsh.exe",
"sh","bash"
)
AND NOT ProcessName IN (ACTIVEMQ_ALLOWED_CHILD_PROCESSES)
Rule 2 — ActiveMQ Broker Context Launching Retrieval or Staging Utility
Rule Format
SentinelOne Deep Visibility
Target Behavior
· ActiveMQ broker execution context launches retrieval or scripting utilities associated with payload staging or remote execution preparation
Signal Mapping
· Anchor: Execution Outcome / Post-Trigger Execution
· Breakpoint: Execution / Retrieval
· Tier: Tier 2 survivor
Constraints
· Must be restricted to confirmed ActiveMQ broker context
· Must require command-line evidence
· Must remain distinct from shell/interpreter execution rule
Exclusions
· Approved update or package retrieval jobs
· Approved internal integrations
· Approved monitoring or orchestration tooling
· Authorized testing activity
Engineering Implementation Instructions
· Reuse broker-context validation from Rule 1
· Build a 30-day baseline of broker-origin launches for:
o curl, wget, python, python3, perl, powershell.exe, pwsh.exe
· Validate command-line visibility
· Determine whether broker legitimately runs retrieval tools
· Allowlist approved:
o command-line patterns
o scripts
o destinations
o maintenance windows
· Restrict deployment to stable environments
· Validate using controlled retrieval/staging execution tests
Failure Conditions
· No command-line visibility
· Broker context not properly scoped
· Legitimate retrieval activity not baselined
· Exploit remains entirely in-JVM
Variant Resilience
· Survives variations in exploit and staging behavior
· Strong against OS-level retrieval or staging activity
· Weak against pure in-JVM execution
DRI: 7.7 / 10
TCR
· Operational: 7.9 / 10
· Full-Telemetry: 8.8 / 10
Detection Logic
EventType = "Process Creation"
AND EndpointName IN (ACTIVEMQ_BROKER_HOSTS)
AND ParentProcessName IN ("java.exe","java","wrapper.exe","wrapper")
AND (
ParentProcessPath CONTAINS ACTIVEMQ_INSTALL_PATH
OR ParentCommandLine CONTAINS "activemq"
OR ParentUser IN (ACTIVEMQ_SERVICE_ACCOUNTS)
)
AND ProcessName IN (
"curl","wget","python","python3","perl",
"powershell.exe","pwsh.exe"
)
AND (
ProcessCommandLine CONTAINS "http://"
OR ProcessCommandLine CONTAINS "https://"
OR ProcessCommandLine CONTAINS "-enc"
OR ProcessCommandLine CONTAINS "invoke-webrequest"
OR ProcessCommandLine CONTAINS "iwr"
OR ProcessCommandLine CONTAINS "download"
)
AND NOT ProcessCommandLine IN (ACTIVEMQ_ALLOWED_RETRIEVAL_PATTERNS)
Splunk
Rule 1 — ActiveMQ Broker Context Spawning Shell or Command Interpreter
Rule Format
Splunk SPL Correlation Search
Target Behavior
· ActiveMQ broker execution context spawns a shell or command interpreter
· Detects OS-level execution outcome consistent with successful exploitation
Signal Mapping
· Anchor: Execution Outcome
· Breakpoint: Code Execution
· Tier: Tier 1
Constraints
· Must be restricted to confirmed ActiveMQ broker context
· Must not be generalized to all Java process activity
· Requires normalized process telemetry in Splunk
Exclusions
· Approved broker maintenance scripts
· Approved administrative automation
· Authorized testing or red-team activity
Engineering Implementation Instructions
· Confirm Splunk ingests normalized process-creation telemetry from one or more of:
o Sysmon
o EDR
o other endpoint sources
· Map or normalize the following fields before deployment:
o dest
o process_name
o parent_process_name
o process_path
o parent_process_path
o process
o parent_process
o user
· Create a lookup or macro for:
o ACTIVEMQ_BROKER_HOSTS
o ACTIVEMQ_SERVICE_ACCOUNTS
o ACTIVEMQ_ALLOWED_CHILD_PROCESSES
· Validate broker context using at least two of:
o broker host identity
o parent command line containing activemq
o parent path under ActiveMQ install path
o broker service account
· Build a 30-day baseline of broker-origin child processes
· Confirm the broker does not normally spawn:
o cmd.exe
o powershell.exe
o pwsh.exe
o sh
o bash
· Add explicit allowlist entries for any verified legitimate exceptions
· Validate against controlled test execution from confirmed broker context
Failure Conditions
· No normalized process-creation telemetry
· Broker context not accurately identified
· Legitimate child process activity not baselined
· Exploit completes with no child process creation
Variant Resilience
· Survives:
o exploit-chain variation
o payload variation
o request-layer changes
· Weak against:
o in-memory-only execution with no child process
DRI: 8.8 / 10
TCR
· Operational: 8.1 / 10
· Full-Telemetry: 9.1 / 10
Detection Logic
`activemq_process_creation_base`
| search dest IN (ACTIVEMQ_BROKER_HOSTS)
| eval parent_name=lower(coalesce(parent_process_name, parent_process))
| eval child_name=lower(coalesce(process_name, process))
| eval parent_cmd=lower(parent_process)
| eval parent_path=lower(parent_process_path)
| where parent_name IN ("java.exe","java","wrapper.exe","wrapper")
| where like(parent_cmd,"%activemq%")
OR like(parent_path,"%activemq%")
OR user IN (ACTIVEMQ_SERVICE_ACCOUNTS)
| where child_name IN ("cmd.exe","powershell.exe","pwsh.exe","sh","bash")
| lookup activemq_allowed_child_processes child_name OUTPUT child_name as allowed_child
| where isnull(allowed_child)
| stats count min(_time) as firstTime max(_time) as lastTime values(user) as user values(parent_name) as parent_name values(child_name) as child_name values(parent_cmd) as parent_cmd by dest
Elastic
Rule 1 — ActiveMQ Broker Context Spawning Shell or Command Interpreter
Rule Format
Elastic EQL Detection Rule
Target Behavior
· ActiveMQ broker execution context spawns a shell or command interpreter
· Detects OS-level execution outcome consistent with successful exploitation
Signal Mapping
· Anchor: Execution Outcome
· Breakpoint: Code Execution
· Tier: Tier 1
Constraints
· Must be restricted to confirmed ActiveMQ broker context
· Must not be generalized to all Java process activity
· Requires normalized endpoint process telemetry mapped to ECS
Exclusions
· Approved broker maintenance scripts
· Approved administrative automation
· Authorized testing or red-team activity
Engineering Implementation Instructions
· Confirm Elastic ingests normalized endpoint process telemetry from one or more of:
o Elastic Defend
o Sysmon via Winlogbeat
o other endpoint sources mapped to ECS
· Validate ECS field availability for:
o host.name
o process.name
o process.executable
o process.command_line
o process.parent.name
o process.parent.executable
o process.parent.command_line
o user.name
· Implement broker scoping using:
o rule exception lists
o value lists
o or equivalent maintained reference artifacts for:
§ ACTIVEMQ_BROKER_HOSTS
§ ACTIVEMQ_SERVICE_ACCOUNTS
§ approved child-process exceptions
· Validate broker context using at least two of:
o broker host identity
o parent command line containing activemq
o parent executable path under ActiveMQ install path
o broker service account
· Build a 30-day baseline of broker-origin child processes
· Confirm the broker does not normally spawn:
o cmd.exe
o powershell.exe
o pwsh.exe
o sh
o bash
· Add explicit exception entries for any verified legitimate child-process behavior
· Validate using controlled execution from confirmed broker context
Failure Conditions
· No normalized process telemetry
· Broker context not accurately identified
· Legitimate child-process behavior not baselined
· Exploit completes with no child-process creation
Variant Resilience
· Survives:
o exploit-chain variation
o payload variation
o request-layer changes
· Weak against:
o in-memory-only execution with no child process
DRI: 8.8 / 10
TCR
· Operational: 8.2 / 10
· Full-Telemetry: 9.1 / 10
Detection Logic
process
where host.name in (ACTIVEMQ_BROKER_HOSTS)
and process.parent.name in ("java", "java.exe", "wrapper", "wrapper.exe")
and (
process.parent.command_line like~ "*activemq*"
or process.parent.executable like~ "*activemq*"
or user.name in (ACTIVEMQ_SERVICE_ACCOUNTS)
)
and process.name in ("cmd.exe", "powershell.exe", "pwsh.exe", "sh", "bash")
and not process.name in (ACTIVEMQ_ALLOWED_CHILD_PROCESSES)
QRadar
Rule 1 — ActiveMQ Broker Context Spawning Shell or Command Interpreter
Rule Format
QRadar CRE Rule
Target Behavior
· ActiveMQ broker execution context spawns a shell or command interpreter
· Detects OS-level execution outcome consistent with successful exploitation
Signal Mapping
· Anchor: Execution Outcome
· Breakpoint: Code Execution
· Tier: Tier 1
Constraints
· Must be restricted to confirmed ActiveMQ broker context
· Must not be generalized to all Java process activity
· Requires QRadar ingestion of endpoint process-creation telemetry with reliable custom-property parsing
Exclusions
· Approved broker maintenance scripts
· Approved administrative automation
· Authorized testing or red-team activity
Engineering Implementation Instructions
· Confirm QRadar ingests endpoint process-creation telemetry from one or more of:
o EDR
o Sysmon-forwarded telemetry
o other endpoint sources with parsable process lineage
· Create and validate custom properties or normalized mappings for:
o host name
o process name
o parent process name
o process path
o parent process path
o command line
o user / service account
· Build and maintain reference sets for:
o ACTIVEMQ_BROKER_HOSTS
o ACTIVEMQ_SERVICE_ACCOUNTS
o ACTIVEMQ_ALLOWED_CHILD_PROCESSES
· Validate broker context using at least two of:
o broker host identity
o parent command line containing activemq
o parent executable/path under ActiveMQ install path
o broker service account
· Build a 30-day baseline of broker-origin child processes
· Confirm the broker does not normally spawn:
o cmd.exe
o powershell.exe
o pwsh.exe
o sh
o bash
· Add verified legitimate exceptions to the appropriate reference set
· Validate with controlled execution from confirmed broker context before production enablement
Failure Conditions
· No process-creation telemetry in QRadar
· Required custom properties not parsed reliably
· Broker context not accurately identified
· Legitimate child-process behavior not baselined
· Exploit completes with no child process creation
Variant Resilience
· Survives:
o exploit-chain variation
o payload variation
o request-layer changes
· Weak against:
o in-memory-only execution with no child process
DRI: 8.7 / 10
TCR
· Operational: 7.8 / 10
· Full-Telemetry: 9.0 / 10
Detection Logic
CRE rule logic
when
the event category indicates Process Creation
and Source Host is in reference set "ACTIVEMQ_BROKER_HOSTS"
and Parent Process Name matches one of:
java
java.exe
wrapper
wrapper.exe
and at least one of the following is true:
Parent Command Line contains "activemq"
Parent Process Path matches ActiveMQ installation path pattern
Username is in reference set "ACTIVEMQ_SERVICE_ACCOUNTS"
and Process Name matches one of:
cmd.exe
powershell.exe
pwsh.exe
sh
bash
and Process Name is not in reference set "ACTIVEMQ_ALLOWED_CHILD_PROCESSES"
then
create offense / alert
SIGMA
Rule 1 — ActiveMQ Broker Context Spawning Shell or Command Interpreter
Rule Format
Sigma Rule Format
Target Behavior
· ActiveMQ broker execution context spawns a shell or command interpreter
· Detects OS-level execution outcome consistent with successful exploitation
Signal Mapping
· Anchor:Execution Outcome
· Breakpoint:Code Execution
· Tier:Tier 1
Constraints
· Must be restricted to confirmed ActiveMQ broker context
· Must not be generalized to all Java process activity
· Requires process-creation telemetry that can be mapped into Sigma-compatible fields
Exclusions
· Approved broker maintenance scripts
· Approved administrative automation
· Authorized testing or red-team activity
Engineering Implementation Instructions
· Confirm the environment supports process-creation telemetry that can be translated via Sigma into the destination platform
· Ensure the following field mappings are available in the destination platform before translation:
o process image / name
o parent process image / name
o process command line
o parent process command line
o user / account context
o host identity
· Implement environment-specific scoping artifacts prior to deployment:
o broker host identification (e.g., asset group, lookup, tag, or reference set)
o broker service accounts
o allowed broker child processes
· Validate broker context using at least two of the following during translation or tuning:
o host identified as ActiveMQ broker
o parent process command line containing activemq
o parent process path/executable under ActiveMQ installation path
o execution under broker service account
· Build a 30-day baseline of broker-origin child processes in the destination platform
· Confirm the broker does not normally spawn:
o cmd.exe
o powershell.exe
o pwsh.exe
o sh
o bash
· Implement allowlists or exception logic in the destination platform for verified legitimate behavior
· Validate detection through controlled execution testing in broker context prior to production deployment
Failure Conditions
· Process-creation telemetry not available or not mapped correctly
· Field mapping inconsistent or incomplete after translation
· Broker context not accurately identified
· Legitimate child-process behavior not baselined
· Exploit completes with no child-process creation
Variant Resilience
· Survives:
o exploit-chain variation
o payload variation
o request-layer changes
· Weak against:
o in-memory-only execution with no child process
DRI: 8.8 / 10
TCR
· Operational: 7.8 / 10
· Full-Telemetry: 9.0 / 10
Detection Logic
title: ActiveMQ Broker Context Spawning Shell or Command Interpreter
id: activemq-broker-shell-spawn
status: experimental
logsource:
category: process_creation
detection:
parent_names:
ParentImage|endswith:
- '\java.exe'
- '\wrapper.exe'
- '/java'
- '/wrapper'
parent_cmd:
ParentCommandLine|contains: 'activemq'
parent_path:
ParentImage|contains: 'activemq'
broker_account:
User|contains: 'activemq'
child_names:
Image|endswith:
- '\cmd.exe'
- '\powershell.exe'
- '\pwsh.exe'
- '/sh'
- '/bash'
condition: parent_names and (parent_cmd or parent_path or broker_account) and child_names
falsepositives:
- Approved broker maintenance activity
- Authorized testing
level: high
YARA
No qualifying YARA rules survive under the current strict standard.
System-Level Determination
YARA is not a strong fit for this exploit chain as a primary detection system. The confirmed abuse path is centered on:
· Jolokia exec invocation
· broker connector abuse
· remote XBean / Spring XML retrieval
· runtime execution on the broker JVM
The strongest behaviors in this case are:
· request-layer
· runtime execution-layer
· process / service-origin execution-layer
YARA is strongest when there is a stable file, memory, or payload artifact that can be scanned reliably. That cannot be assumed here.
Why No YARA Rule Qualifies
Any candidate YARA rule for this case would fail for one or more of the following reasons:
· it would depend on artifact recovery that may never occur in real deployment
· it would be tied to narrow POC strings rather than durable detection behavior
· it would assume the malicious Spring XML, class material, or related payload is:
o captured on disk
o retained in memory in a scannable form
o or available to a YARA-capable workflow
· it would overstate deployability for exploit paths that remain:
o remote
o runtime-only
o in-JVM
o non-persistent
Engineering Position
If an organization later confirms it has a workflow that routinely acquires one or more of the following, YARA can be revisited:
· remote Spring XML payloads
· malicious Java artifacts dropped to disk
· memory snapshots from the broker JVM
· captured exploit-stage files for retrospective scanning
Under the current standard, without assuming those conditions, publishing a YARA rule would be weaker than publishing none.
AWS
Rule 1 — External Interaction with ActiveMQ Jolokia Endpoint from Untrusted Source
Rule Format
AWS WAF / ALB Log Analysis (CloudWatch Logs Insights or Athena Query)
Target Behavior
· External, untrusted source interacting with the ActiveMQ Jolokia endpoint on broker infrastructure
· Detects pre-execution exploit-attempt behavior consistent with Jolokia abuse
Signal Mapping
· Anchor: Exploit Attempt (Pre-Execution)
· Breakpoint: Initial Access / Exploit Trigger
· Tier: Conditional Primary
Constraints
· Requires:
o AWS WAF logs
o or ALB / reverse proxy logs with URI visibility
· Must be restricted to:
o confirmed ActiveMQ broker endpoints
· Must enforce:
o external / untrusted source scoping
o strict Jolokia path scoping
· Must not be used as generic URI monitoring
Exclusions
· Trusted administrative IP ranges
· Internal monitoring systems
· Approved automation interacting with Jolokia
Engineering Implementation Instructions
· Confirm HTTP request logging through:
o AWS WAF logging
o ALB access logs with URI visibility
· Identify and scope broker exposure using:
o ALB target groups serving ActiveMQ
o EC2 instances tagged or grouped as brokers
o known broker-facing endpoints
· Restrict detection to:
o /api/jolokia/ only
· Implement source scoping:
o exclude trusted administrative IP ranges
o exclude internal monitoring and management sources
o focus on untrusted or external source space
· Build baseline for:
o normal Jolokia usage, if any
o expected source ranges
o expected request volume
· Tune to alert on:
o first-time untrusted access
o or abnormal request frequency from an untrusted source
· Validate using:
o controlled external Jolokia access tests
o known legitimate administrative activity
Failure Conditions
· No WAF or ALB request logging
· Jolokia endpoint not externally exposed
· URI field not present in logs
· Legitimate Jolokia usage not baselined
· Source scoping not defined
Variant Resilience
· Survives:
o variations in exploit payload formatting
o parameter obfuscation
o changes in request contents after endpoint access
· Weak against:
o authenticated internal misuse
o trusted-source proxying
o environments with legitimate external Jolokia access
DRI: 7.6 / 10
TCR
· Operational: 7.0 / 10
· Full-Telemetry: 8.6 / 10
Detection Logic
fields @timestamp, client_ip, request_uri, user_agent, target_group
| filter request_uri = "/api/jolokia/"
| filter client_ip not in (TRUSTED_IP_RANGES)
| filter target_group in (ACTIVEMQ_BROKER_TARGET_GROUPS)
| stats count() as request_count by client_ip, user_agent, target_group
| filter request_count > BASELINE_THRESHOLD
| sort request_count desc
Azure
Rule 1 — External Interaction with ActiveMQ Jolokia Endpoint from Untrusted Source
Rule Format
Azure Application Gateway / WAF Logs (KQL Detection Rule)
Target Behavior
· External, untrusted source interacting with the ActiveMQ Jolokia endpoint
· Detects pre-execution exploit-attempt behavior consistent with Jolokia abuse
Signal Mapping
· Anchor: Exploit Attempt (Pre-Execution)
· Breakpoint: Initial Access / Exploit Trigger
· Tier: Conditional Primary
Constraints
· Requires:
o Azure Application Gateway logs
o or Azure WAF logs with request URI visibility
· Must be restricted to:
o confirmed ActiveMQ broker endpoints
· Must enforce:
o external / untrusted source filtering
o strict Jolokia path scoping
· Must not be used as generic URI monitoring
Exclusions
· Trusted administrative IP ranges
· Internal monitoring systems
· Approved automation interacting with Jolokia
Engineering Implementation Instructions
· Confirm ingestion of:
o Application Gateway access logs
o or Azure WAF logs into Log Analytics
· Identify broker exposure:
o backend pools hosting ActiveMQ
o frontend listeners exposing broker endpoints
· Restrict detection to:
o /api/jolokia/ endpoint only
· Implement source filtering:
o exclude trusted administrative IP ranges
o exclude internal and monitoring traffic
· Build baseline:
o expected Jolokia usage (if any)
o expected source IP patterns
o expected request frequency
· Tune detection to alert on:
o first-time external access
o or abnormal request volume from an untrusted source
· Validate using:
o controlled external Jolokia access
o known legitimate administrative access patterns
Failure Conditions
· No Application Gateway or WAF logging enabled
· Jolokia endpoint not externally exposed
· Request URI not present in logs
· Legitimate usage not baselined
· Source scoping not defined
Variant Resilience
· Survives:
o payload variation
o parameter obfuscation
o changes in request content after endpoint access
· Weak against:
o authenticated internal misuse
o trusted proxy access
o environments with legitimate external Jolokia usage
DRI: 7.6 / 10
TCR
· Operational: 7.1 / 10
· Full-Telemetry: 8.7 / 10
Detection Logic
AzureDiagnostics
| where ResourceType == "APPLICATIONGATEWAYS"
| where requestUri_s == "/api/jolokia/"
| where clientIP_s !in (TRUSTED_IP_RANGES)
| where backendPoolName_s in (ACTIVEMQ_BROKER_BACKENDS)
| summarize request_count = count() by clientIP_s, userAgent_s, backendPoolName_s
| where request_count > BASELINE_THRESHOLD
| order by request_count desc
GCP
Rule 1 — External Interaction with ActiveMQ Jolokia Endpoint from Untrusted Source
Rule Format
GCP HTTP(S) Load Balancer Logs / Cloud Logging Detection Query
Target Behavior
· External, untrusted source interacting with the ActiveMQ Jolokia endpoint
· Detects pre-execution exploit-attempt behavior consistent with Jolokia abuse
Signal Mapping
· Anchor: Exploit Attempt (Pre-Execution)
· Breakpoint: Initial Access / Exploit Trigger
· Tier: Conditional Primary
Constraints
· Requires:
o GCP HTTP(S) Load Balancer logs
o or equivalent ingress / reverse proxy logs with request URI visibility
· Must be restricted to:
o confirmed ActiveMQ broker-facing services
· Must enforce:
o external / untrusted source filtering
o strict Jolokia path scoping
· Must not be used as generic URI monitoring
Exclusions
· Trusted administrative IP ranges
· Internal monitoring systems
· Approved automation interacting with Jolokia
Engineering Implementation Instructions
· Confirm ingestion of:
o GCP HTTP(S) Load Balancer logs into Cloud Logging
o or equivalent ingress / reverse proxy logs with URI visibility
· Identify broker exposure using:
o backend services hosting ActiveMQ
o instance groups or NEGs serving broker traffic
o known broker-facing endpoints
· Restrict detection to:
o /api/jolokia/ endpoint only
· Implement source filtering:
o exclude trusted administrative IP ranges
o exclude internal and monitoring traffic
· Build baseline for:
o expected Jolokia usage, if any
o expected source IP patterns
o expected request frequency
· Tune detection to alert on:
o first-time external access
o or abnormal request volume from an untrusted source
· Validate using:
o controlled external Jolokia access
o known legitimate administrative access patterns
Failure Conditions
· No HTTP(S) Load Balancer or equivalent ingress logging enabled
· Jolokia endpoint not externally exposed
· Request URI not present in logs
· Legitimate usage not baselined
· Source scoping not defined
Variant Resilience
· Survives:
o payload variation
o parameter obfuscation
o changes in request content after endpoint access
· Weak against:
o authenticated internal misuse
o trusted proxy access
o environments with legitimate external Jolokia usage
DRI: 7.6 / 10
TCR
· Operational: 7.1 / 10
· Full-Telemetry: 8.7 / 10
Detection Logic
resource.type="http_load_balancer"
httpRequest.requestUrl =~ ".*/api/jolokia/?$"
NOT jsonPayload.remoteIp IN (TRUSTED_IP_RANGES)
jsonPayload.backendServiceName IN (ACTIVEMQ_BROKER_BACKEND_SERVICES)
| stats count() as request_count by jsonPayload.remoteIp, httpRequest.userAgent, jsonPayload.backendServiceName
| where request_count > BASELINE_THRESHOLD
S26 Threat-to-Rule Traceability Matrix
Purpose
Provides direct traceability between confirmed threat behaviors and surviving detection rules across all systems. Ensures detection coverage is explicit, non-inferred, and accurately reflects both strengths and gaps.
All behaviors in this section are derived from validated exploit mechanics (POC) and reflect real-world exploitation patterns, including alignment with Known Exploited Vulnerability (KEV) context where applicable.
Jolokia Endpoint Exposure
· Description: External interaction with /api/jolokia/ endpoint as the initial access surface
· Detection Coverage:
o Suricata: Detects exploit-aligned HTTP interaction patterns tied to Jolokia access
o AWS: Conditional detection of external Jolokia interaction (pre-execution)
o Azure: Conditional detection of external Jolokia interaction (pre-execution)
o GCP: Conditional detection of external Jolokia interaction (pre-execution)
· Coverage Classification:
o Strong (network-layer inspection)
o Conditional (cloud-native pre-execution detection)
Exploit Invocation (type=exec)
· Description: Execution of commands via Jolokia MBean operation as demonstrated in POC
· Detection Coverage:
o Suricata: Direct detection via request-layer inspection of exploit invocation patterns
· Coverage Classification:
o Strong
Broker Connector Abuse (addNetworkConnector)
· Description: Malicious connector creation enabling remote code execution as validated in POC
· Detection Coverage:
o Suricata: Detects exploit chain elements associated with connector abuse
· Coverage Classification:
o Strong
Remote Configuration Load (brokerConfig, xbean)
· Description: Remote XML configuration retrieval and execution used to achieve code execution
· Detection Coverage:
o Suricata: Detects request-layer patterns aligned with remote configuration loading behavior
· Coverage Classification:
o Strong
JVM-Level Execution Trigger
· Description: Runtime execution within the ActiveMQ JVM following successful exploit chain execution
· Detection Coverage:
o No surviving rules across systems
· Coverage Classification:
o Gap
OS-Level Command Execution
· Description: Broker process spawning shell or command interpreter as a result of exploit execution
· Detection Coverage:
o SentinelOne: Primary execution-outcome detection
o Splunk: Primary execution-outcome detection
o Elastic: Primary execution-outcome detection
o QRadar: Primary execution-outcome detection
o SIGMA: Portable execution-outcome detection
· Coverage Classification:
o Strong
Payload Retrieval / Staging
· Description: Execution of external utilities or scripts for payload delivery following initial compromise
· Detection Coverage:
o SentinelOne: Detection of payload retrieval and staging behavior
· Coverage Classification:
o Partial
External Exploit Attempt Activity
· Description: Untrusted source interaction with exposed Jolokia endpoint consistent with exploit-attempt behavior
· Detection Coverage:
o Suricata: Detects exploit-aligned request behavior
o AWS: Conditional exploit-attempt detection
o Azure: Conditional exploit-attempt detection
o GCP: Conditional exploit-attempt detection
· Coverage Classification:
o Strong (network-layer)
o Conditional (cloud platforms)
Coverage Integrity Summary
· All mappings are based strictly on surviving S25 rules only
· No inferred or assumed detection coverage is included
· All behaviors are grounded in:
o validated exploit chain mechanics (POC)
o real-world exploitation activity (KEV where applicable)
· Detection prioritization reflects:
o confirmed attacker behavior, not theoretical attack paths
· Cloud detections are explicitly limited to:
o pre-execution / exploit-attempt signals
Key Detection Gaps
· No reliable detection of:
o fully in-JVM execution without OS-level process spawn
· Limited visibility into:
o exploit parameters outside network-layer inspection (Suricata)
· Cloud platforms:
o do not confirm exploit success
o only detect pre-execution interaction
S27 Behavior & Log Artifacts
Purpose
Defines observable behaviors and associated telemetry artifacts across endpoint, network, and cloud layers. Establishes the concrete signals that underpin detection rules and investigation workflows.
All behaviors are grounded in validated exploit mechanics (POC) and reflect real-world exploitation patterns.
Endpoint / EDR Telemetry
Behavior: Java Broker Execution Pivot
· Description: ActiveMQ broker process (java / wrapper) executes actions outside normal broker function following exploit chain execution
· Log Artifacts:
o process creation events showing broker parent process
o parent command line containing activemq
o service account execution context
o abnormal child process lineage
Behavior: Shell Spawn from Broker Context
· Description: Broker process spawns shell or command interpreter as a result of POC-aligned execution (Runtime.exec)
· Log Artifacts:
o child processes:
§ cmd.exe
§ powershell.exe
§ sh / bash
o parent process:
§ java / wrapper
o command-line arguments indicating execution
Behavior: Post-Exploitation Recon
· Description: Attacker executes discovery commands following successful execution
· Log Artifacts:
o commands such as:
§ whoami
§ hostname
§ net user
§ ipconfig / ifconfig
o short-lived execution chains
o execution under broker service account
Network / Cloud Edge Telemetry
Behavior: Jolokia Exploit Attempt Activity
· Description: Interaction with /api/jolokia/ endpoint aligned to POC mechanics, including use of:
o type=exec
o addNetworkConnector
o brokerConfig
· Log Artifacts:
o HTTP requests to:
§ /api/jolokia/
o external / untrusted source IPs
o repeated or abnormal request patterns
o user-agent anomalies
Behavior: Automated Targeting / Scanning
· Description: Broad or repeated probing of exposed Jolokia endpoints consistent with exploitation attempts
· Log Artifacts:
o high-frequency requests from single source
o distributed source IP activity targeting broker endpoints
o repeated endpoint access patterns
o enumeration behavior
File / Artifact Telemetry
Behavior: Remote Configuration Artifact Retrieval
· Description: Broker retrieves remote configuration (e.g., xbean, brokerConfig) as part of exploit chain
· Log Artifacts:
o outbound network connections from broker
o connections to non-baselined external hosts
o retrieval of XML or configuration content
· Limitations:
o artifacts may be:
§ transient
§ remote
§ not retained locally
Behavior: Payload / Script Execution Artifacts
· Description: Execution of externally retrieved payloads or scripts following exploitation
· Log Artifacts:
o command-line execution referencing remote resources
o interpreter execution (e.g., powershell, bash)
o short-lived execution traces
· Limitations:
o artifacts may not persist on disk
o execution may occur fully in-memory
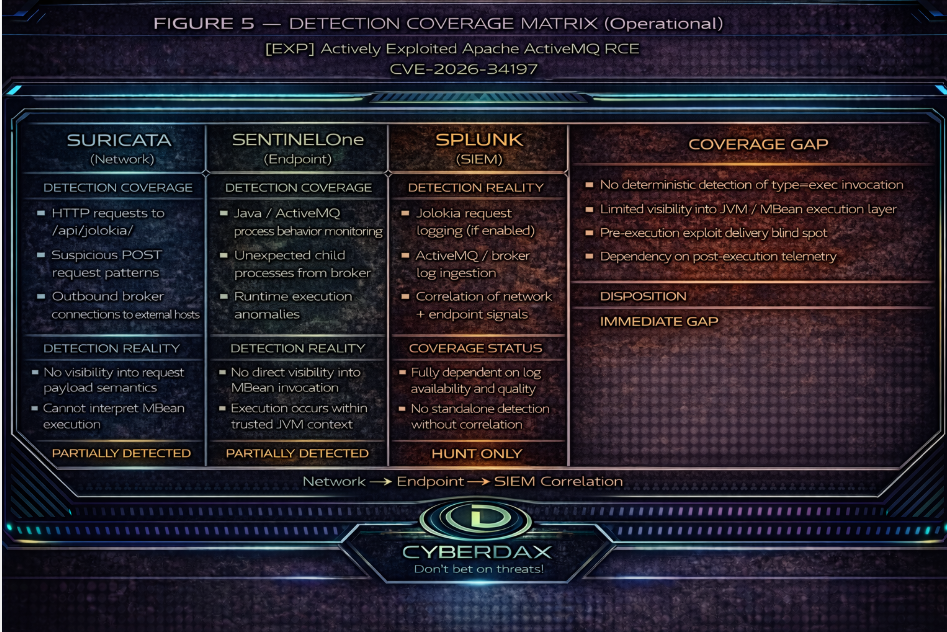
Figure 5
S28 Detection Strategy and SOC Implementation Guidance
Detection Strategy
Detection is structured across three layers:
· Network Layer:
o identify exploit attempt via Jolokia interaction
· Endpoint Layer:
o detect execution pivot and OS-level command execution
· Cloud Layer:
o detect pre-execution interaction in exposed environments
Detection prioritization is enforced as:
· Primary: execution outcome detection (highest confidence)
· Secondary: network exploit detection (Suricata)
· Tertiary: cloud exploit-attempt detection (conditional support)
SOC Enforcement Model
Tier 1 — Alert-Capable Detection
· endpoint execution detections:
o broker spawning shell
· Suricata exploit detection (when available)
· cloud exploit-attempt rules (conditional, lower priority)
Tier 2 — Correlation Requirement
· correlate:
o network exploit attempt → endpoint execution
· link:
o external source → broker activity
· identify:
o multi-stage attack progression
Tier 3 — Investigation Layer
· validate:
o execution chain
· analyze:
o process lineage
· review:
o outbound connections
o follow-on activity
Implementation Enforcement
· enforce strict broker scoping across all detections
· require baseline development prior to tuning
· require allowlists for:
o administrative behavior
· ensure telemetry coverage for:
o process creation
o network interaction
· validate detections using controlled testing
S29 Detection Coverage Summary
Detected Behaviors
· Jolokia exploit attempt activity (network / cloud)
· OS-level command execution from broker
· post-exploitation command execution
Conditional Post-Exploitation Behaviors
· payload retrieval
· outbound connections
· staging activity
These behaviors are:
· environment-dependent
· not guaranteed to produce observable artifacts
· dependent on telemetry availability and attacker technique
Coverage Alignment
· Suricata:
o exploit-chain detection
· Endpoint systems:
o execution outcome detection
· Cloud systems:
o pre-execution exploit-attempt detection
Each system contributes to a distinct detection layer without overlap assumptions.
Coverage Integrity
· no inferred detection coverage
· no system credited beyond capability
· all detections mapped to surviving S25 rules only
· cloud detections explicitly limited to:
o pre-execution signals
· endpoint detections anchor:
o confirmed compromise
S30 Intelligence Maturity Assessment
Detection Maturity
· High maturity at:
o execution detection layer
o exploit detection (network layer)
· Moderate maturity at:
o cloud detection layer
· Low maturity at:
o JVM-level execution visibility
Control Effectiveness Assessment
This is a qualitative assessment based on detection coverage and control alignment, not derived scoring.
· Strong effectiveness for:
o detecting exploitation outcomes
· Moderate effectiveness for:
o detecting exploit attempts
· Limited effectiveness for:
o detecting in-JVM execution without OS-level artifacts
S31 — Telemetry Dependencies
Effective detection and response depend on the availability and quality of telemetry aligned to observable stages of the attack chain.
Required Telemetry Layers
Network / Web Layer
• visibility into inbound management interface interaction
• URI-level logging for management endpoints
• request-level inspection where available
Outbound Network Telemetry
• broker-initiated connections
• destination tracking and timing correlation
• DNS visibility for domain resolution
Endpoint / Process Telemetry
• process creation and lineage on broker host
• command execution visibility under broker context
Application / Service Logging (Conditional but High Value)
• management interface request logging
• runtime operation visibility
Minimum Viable Telemetry
• identification of management interface access
• outbound network visibility from broker host
High-Confidence Telemetry Stack
• inbound request visibility + outbound network telemetry + endpoint process visibility
Dependency Implications
• absence of request visibility removes direct observation of exploit trigger
• absence of outbound telemetry weakens confirmation of execution chains
• absence of endpoint telemetry prevents validation of execution outcomes
S32 — Detection Limitations
Detection capability is constrained by both telemetry gaps and exploit characteristics.
Primary Limitations
• execution may occur entirely within runtime without process artifacts
• management interface activity may resemble legitimate administrative behavior
• exploit does not require file-based payloads
• outbound communication is not guaranteed
Telemetry-Driven Gaps
• no application-layer visibility eliminates direct trigger detection
• no outbound telemetry removes confirmation pathways
• no endpoint telemetry limits post-execution visibility
Behavioral Blind Spots
• authenticated misuse indistinguishable from legitimate activity under weak controls
• low-noise exploitation avoiding anomaly thresholds
• internal exploitation within trusted network segments
Detection Boundary
• high-confidence detection requires at least one observable stage
• runtime-only execution in telemetry-denied environments cannot be reliably detected
S33 — Defensive Control & Hardening Improvements
Access Control Hardening
• restrict management interface access to dedicated administrative systems
• enforce strong authentication and authorization
• eliminate unnecessary external exposure
Network Segmentation
• isolate broker systems from untrusted networks
• restrict east-west communication to required paths
• enforce least-privilege connectivity
Monitoring Enhancements
• enable logging for management interface interaction
• implement outbound monitoring from broker systems
• ensure endpoint visibility for broker execution context
Configuration Hardening
• restrict execution-capable management operations where possible
• enforce secure deployment configurations
• validate runtime configuration integrity
Operational Controls
• establish baseline for normal management activity
• define allowlists for administrative behavior
• validate detections against real operational patterns
S34 — Defensive Control & Hardening Architecture

Figure 6
Defense must be implemented as a layered model aligned to the attack path.
Perimeter / Edge Layer
• restrict exposure of management interfaces
• enforce ingress filtering and access control
Application / Service Layer
• control and monitor management interface usage
• enforce authentication and operational restrictions
Host / Endpoint Layer
• monitor execution behavior within broker context
• detect abnormal process or command activity
Network Layer
• monitor outbound communication from broker systems
• enforce egress controls and anomaly detection
Operational Layer
• maintain behavioral baselines
• support correlation across inbound, execution, and outbound activity
S35 — Defensive Control Mapping Matrix
Management Interface Exposure
• Control: access restriction, authentication enforcement
• Layer: perimeter / application
• Purpose: prevent unauthorized interaction
Execution Trigger (Management Abuse)
• Control: request visibility, behavioral monitoring
• Layer: application / network
• Purpose: detect exploit initiation
Runtime Execution
• Control: endpoint process visibility
• Layer: host / endpoint
• Purpose: detect execution outcomes
Outbound Activity
• Control: egress monitoring, DNS visibility
• Layer: network
• Purpose: confirm exploit progression
Post-Exploitation Activity
• Control: segmentation, behavioral monitoring
• Layer: network / endpoint
• Purpose: limit lateral movement
S36 — CyberDax Intelligence Maturity Assessment (SCORED, TRACEABLE)
Detection Robustness Index
S25 Endpoint Execution Rules (SentinelOne, Splunk, Elastic, QRadar, SIGMA)
• DRI: ≥8.7–8.9
• Justification:
• strong behavioral anchoring to execution outcome
• independent of exploit path variation
• low reliance on fragile artifacts
• does not depend on correlation
S25 Network Detection Rules (Suricata)
• DRI:
• Primary exec invocation rule: ~8.8
• Survivor exploit-chain rule: ~7.8
• Justification:
• strong alignment to execution trigger behavior
• partially dependent on request visibility
• survivor rule constrained by exploit-path specificity
S25 Cloud Pre-Execution Rules (AWS, Azure, GCP)
• DRI: ~7.6
• Justification:
• detects exploit-attempt behavior only
• dependent on exposure and request logging
• does not confirm execution
DRI Gap
• no high-DRI detection exists for:
• runtime-only execution without process creation
• execution paths lacking observable request or network signals
Telemetry Confidence Rating (TCR)
Operational TCR (Real-World Conditions)
• Moderate (≈6.5–7.5)
Driven by:
• inconsistent application-layer logging
• partial outbound network visibility
• uneven endpoint telemetry deployment
Full-Telemetry TCR (Ideal Conditions)
• High (≈8.5–9.2)
Requires:
• request-layer visibility
• outbound network and DNS telemetry
• endpoint process monitoring
Telemetry Gap Impact
• absence of request visibility eliminates exploit-trigger detection
• absence of outbound telemetry removes confirmation of execution chains
• absence of endpoint telemetry removes execution validation
Highest Impact Gap:
• lack of application-layer request visibility
Detection Maturity Summary
• Strong at:
• execution outcome detection (endpoint rules)
• network-layer detection when request visibility exists
• Moderate at:
• outbound correlation
• cloud-based exploit-attempt detection
• Weak at:
• runtime-only execution visibility
S37 — Strategic Defensive Improvements
Priority 1 — Eliminate Exposure Risk
• remove or strictly restrict management interface exposure
• enforce access boundaries and authentication controls
Priority 2 — Close Critical Telemetry Gaps
• deploy application-layer visibility for management interfaces
• ensure outbound network and DNS monitoring
• enforce endpoint visibility on broker systems
Priority 3 — Strengthen Detection Reliability
• align detections to observable behavioral anchors
• reduce reliance on indirect or low-signal indicators
Priority 4 — Reduce Blast Radius
• enforce segmentation between broker and internal systems
• limit unnecessary connectivity
Priority 5 — Improve Operational Readiness
• maintain validated behavioral baselines
• continuously test detection and response effectiveness
S38 — Attack Economics & Organizational Impact Model
The economic model reflects asymmetry between low attacker cost and increasing defender cost, driven by exposure conditions and detection timing as defined in S6 and S6A.
Adversary Economics
Low Cost of Execution
• Publicly available proof-of-concept (POC) removes the need for exploit development.
• Minimal infrastructure is required to initiate exploitation.
High Repeatability and Scale
• Standardized methods enable consistent exploitation across environments.
• KEV inclusion confirms active exploitation and increases attacker prioritization.
Exposure-Driven Efficiency
• Success depends on exposed or weakly controlled management interfaces.
• Partially secured environments remain viable targets.
Defender Cost Dynamics
Cost Acceleration Drivers
• Detection delay increases investigation and containment scope.
• Interaction with connected systems expands recovery effort.
• System interconnectivity increases operational disruption impact.
Cost Containment Conditions
• Restricted access to management interfaces reduces attack surface.
• Early detection limits expansion beyond initial compromise.
• Segmentation reduces cross-system recovery requirements.
Economic Asymmetry
• Attacker cost remains low regardless of scale due to POC availability.
• Defender cost increases with:
• exposure scope
• detection delay
• expansion into connected systems
• The KEV and POC combination increases attack frequency without increasing attacker cost.
S39 — Economic Impact & Organizational Exposure

Figure 7
Impact Progression Model
Stage 1
Initial Compromise
• Localized broker compromise.
• Limited containment and investigation cost.
• Minimal operational disruption.
Stage 2
Internal Expansion
• Interaction with connected systems and services.
• Increased investigation scope and containment complexity.
• Rising operational impact due to system dependencies.
Stage 3
Systemic Impact
• Disruption across dependent services.
• Extended recovery effort across systems.
• Potential data exposure and regulatory consequences.
Organizational Exposure Drivers
• Exposure of management interfaces to external or broadly accessible internal networks.
• Weak segmentation between broker and critical systems.
• High reliance on the broker for system integration and communication.
• Limited visibility into management activity and runtime execution.
Exposure Amplification Factors
• KEV listing confirms active exploitation and increases targeting likelihood.
• POC availability enables rapid, large-scale exploitation attempts.
• The centralized broker role increases downstream impact potential.
• Detection gaps increase dwell time and expansion probability.
Exposure Reduction Factors
• Strict access control over management interfaces.
• Segmentation limiting broker-to-system communication.
• Visibility across network and endpoint layers.
• Rapid detection and containment capability.
S40 — References
Vendor Advisory
• Apache ActiveMQ Security Advisory — CVE-2026-34197
hxxps[:]//activemq[.]apache[.]org/security-advisories[.]data/CVE-2026-34197-announcement[.]txt
• Apache ActiveMQ Security Advisories Index
hxxps[:]//activemq[.]apache[.]org/security-advisories
Vulnerability Records
• MITRE CVE Record — CVE-2026-34197
hxxps[:]//www[.]cve[.]org/CVERecord[?]id=CVE-2026-34197
• National Vulnerability Database (NVD) — CVE-2026-34197
hxxps[:]//nvd[.]nist[.]gov/vuln/detail/CVE-2026-34197
Known Exploited Vulnerabilities (KEV)
• CISA Known Exploited Vulnerabilities Catalog
hxxps[:]//www[.]cisa[.]gov/known-exploited-vulnerabilities-catalog
• CISA KEV Update — April 16, 2026, adding CVE-2026-34197 based on evidence of active exploitation
Security Vendor Analysis
• Horizon3.ai — ActiveMQ RCE (Jolokia) Disclosure
hxxps[:]//horizon3[.]ai/attack-research/disclosures/cve-2026-34197-activemq-rce-jolokia/
• Check Point Advisory — CVE-2026-34197 Protection Coverage
hxxps[:]//advisories[.]checkpoint[.]com/defense/advisories/public/2026/cpai-2026-2671[.]html