[EXP] HTTP/2 Header Abuse and Memory Exhaustion Across Web Infrastructure

Report Type: EXP
Threat Category: Protocol-Layer Resource Exhaustion / Web Infrastructure Denial-of-Service Exposure
Assessment Date: June 3, 2026
Primary Impact Domain: Web Infrastructure Availability and Service Continuity
Secondary Impact Domains:
· Application Performance and Customer-Facing Service Reliability.
· API, Authentication, Portal, and Payment Workflow Availability.
· Cloud, Kubernetes, CDN, WAF, Load-Balancer, Gateway, and Reverse-Proxy Stability.
· SOC Detection Engineering and Incident Triage Readiness.
Affected Asset Class: HTTP/2-enabled web infrastructure, including internet-facing web servers, reverse proxies, API gateways, WAF-protected applications, CDN origins, cloud load balancers, Kubernetes ingress controllers, service-mesh ingress gateways, application front ends, containerized web workloads, and cloud-hosted backend services.
Threat Objective Classification: Resource Exhaustion, Service Degradation, Availability Disruption, Edge-to-Backend Pressure Amplification, and Conditional Post-Event Intrusion Validation.
BLUF
HTTP/2 header abuse and memory exhaustion across web infrastructure creates material enterprise risk because normal protocol handling can be turned into a resource-exhaustion pathway against internet-facing web servers, reverse proxies, API gateways, WAF-protected applications, load balancers, CDN origins, Kubernetes ingress controllers, service-mesh gateways, and customer-facing application front ends. The core risk is whether abnormal header, CONTINUATION-frame, stream-reset, request-cancellation, or protocol-error behavior can create memory pressure, worker exhaustion, gateway instability, backend retry expansion, route degradation, or user-facing availability loss across business-critical services. Suspicious HTTP/2 activity becomes materially significant when abnormal protocol behavior can be tied to resource pressure, edge-service failure, downstream latency, autoscaling surge, target-health degradation, protective-control activation, or customer-impacting service disruption. Immediate executive action is required to validate HTTP/2 exposure, confirm protocol-to-resource telemetry, baseline normal HTTP/2 behavior, harden mitigation paths, and treat suspected HTTP/2 resource exhaustion as an application-delivery resilience incident rather than an isolated web error or generic traffic spike.
Executive Risk Translation
HTTP/2 header abuse and memory exhaustion shifts the business risk from ordinary web availability noise to loss of confidence in the organization’s ability to keep customer-facing digital services stable under protocol-level stress. If HTTP/2-facing routes, gateways, ingress controllers, reverse proxies, CDN origins, load-balancer targets, or API front ends cannot be tied to reliable protocol, source, resource, and service-impact telemetry, leadership may need to assume that degraded web performance, gateway failures, backend saturation, or user-facing outages could be caused by targeted protocol-resource abuse rather than normal traffic. That response can expand into emergency mitigation, HTTP/2 exposure review, CDN and WAF tuning, header and stream-limit changes, gateway and ingress hardening, cloud and Kubernetes scaling review, application performance analysis, customer-impact assessment, legal and executive reporting, and broader validation of business-critical web-delivery infrastructure.
S3 — Why This Matters Now
· HTTP/2 is commonly deployed across the same public-facing paths that support customer portals, APIs, SaaS access, payment workflows, cloud ingress, Kubernetes ingress, service meshes, WAF-protected applications, and CDN-to-origin delivery.
· Header abuse, CONTINUATION-frame behavior, stream reset behavior, and request cancellation can impose server-side work that is disproportionate to completed requests or successful application transactions.
· The highest-risk condition occurs when abnormal HTTP/2 behavior is followed by memory growth, worker exhaustion, gateway errors, process restarts, pod evictions, target-health degradation, autoscaling surge, backend retry storms, or user-facing service degradation.
· Ordinary web telemetry can make this activity difficult to classify because isolated errors, resets, protocol warnings, memory spikes, restarts, or timeouts may also occur during benign traffic surges, client cancellations, deployments, failovers, load tests, synthetic monitoring, or security testing.
· Missing HTTP/2 protocol fields, frame-level visibility, route-to-service mapping, resource telemetry, cloud telemetry, Kubernetes telemetry, or change-control context can force broader investigation because the organization cannot quickly prove whether protocol behavior caused service impact.
· Response requires coordination across SOC, network, application, platform, DevOps, cloud, Kubernetes, CDN, WAF, and incident-response teams because the activity may appear simultaneously as protocol anomalies, infrastructure pressure, application latency, and availability degradation.
S4 — Key Judgments
· HTTP/2 header abuse and memory exhaustion should be treated as a protocol-layer application-delivery resilience risk, not only as a single-CVE, single-vendor, web-server, or generic DDoS issue.
· The primary enterprise risk is resource exhaustion and availability degradation across HTTP/2-facing infrastructure that terminates, proxies, inspects, routes, or supports business-critical web traffic.
· Suspicious HTTP/2 behavior followed by memory pressure, worker exhaustion, gateway instability, backend retries, target-health degradation, autoscaling surge, route degradation, or user-facing errors is the strongest executive risk signal.
· Isolated oversized headers, stream resets, request cancellations, protocol errors, HTTP status spikes, memory spikes, process restarts, pod restarts, or gateway timeouts should not be treated as confirmed malicious activity without supporting protocol, source, resource, service-impact, change-control, or incident-response evidence.
· Business exposure increases sharply when affected infrastructure supports authentication, customer portals, APIs, payment paths, SaaS front ends, regulated services, cloud ingress, Kubernetes ingress, service-mesh ingress, or revenue-generating digital workflows.
· Incomplete telemetry increases cost because the organization may need to prove service-impact lineage through expanded review of proxy logs, WAF logs, CDN logs, API-gateway logs, ingress logs, service-mesh logs, resource telemetry, cloud events, Kubernetes events, application performance data, and change-control records.
· The most damaging outcome occurs when HTTP/2 resource exhaustion causes prolonged customer-facing outage, repeated service instability, emergency traffic shaping, temporary HTTP/2 exposure reduction, SLA impact, revenue interruption, customer trust erosion, regulatory scrutiny, or broad uncertainty around web-delivery resilience.
S5 — Executive Risk Summary
Business Risk
HTTP/2 header abuse and memory exhaustion can degrade or disrupt customer-facing digital services by forcing abnormal memory allocation, header buffering, stream tracking, worker consumption, queue growth, gateway instability, or downstream service pressure across exposed web infrastructure. Risk increases when affected services include authentication routes, API routes, payment workflows, customer portals, SaaS front ends, cloud ingress paths, Kubernetes ingress controllers, service-mesh gateways, CDN origins, WAF-protected applications, or other business-critical application-delivery paths.
Technical Cause
The risk is driven by abnormal HTTP/2 protocol behavior involving excessive header processing, CONTINUATION-frame activity, incomplete header sequences, stream reset behavior, request cancellation, high stream churn, header-limit events, frame-limit events, protocol errors, request rejection, or traffic patterns that create disproportionate server-side work. Technical exposure becomes material when that behavior aligns with memory pressure, CPU pressure, worker exhaustion, queue expansion, connection-table growth, event-loop delay, gateway errors, target-health degradation, origin withdrawal, pod restart, container eviction, autoscaling surge, backend latency, or application degradation.
Threat Posture
The threat posture is elevated because HTTP/2-facing infrastructure may continue processing attacker-controlled protocol behavior as normal web traffic until resource pressure, gateway instability, backend retry expansion, or user-facing degradation appears. The posture becomes critical when suspicious HTTP/2 activity affects business-critical routes, appears across multiple edge nodes or regions, aligns with resource exhaustion, produces downstream application impact, activates mitigation controls, or occurs without approved load testing, deployment, failover, synthetic monitoring, vulnerability scanning, CDN change, WAF tuning, ingress update, service-mesh update, or HTTP/2 configuration change.
Executive Decision Requirement
Executives must require measurable assurance that HTTP/2-enabled assets are inventoried, business-critical routes are mapped, protocol and resource telemetry are retained, route-to-service lineage is validated, normal HTTP/2 behavior is baselined, WAF and CDN controls are tuned, gateway and ingress limits are enforced, change-control context is integrated, and response teams can rapidly distinguish malicious protocol-resource abuse from legitimate traffic, testing, deployment, failover, or application-performance events.
S6 — Executive Cost Summary
HTTP/2 header abuse and memory exhaustion creates scenario-based financial exposure when an organization must prove or disprove whether abnormal protocol behavior caused service instability, customer-facing downtime, degraded application performance, emergency mitigation, cloud or Kubernetes scaling pressure, or downstream business disruption. The estimated impact is driven by outage duration, number of affected routes, customer-facing service dependency, revenue sensitivity, SLA exposure, cloud and CDN surge costs, WAF and gateway tuning effort, incident-response workload, application performance analysis, telemetry reconstruction, executive reporting, legal review, customer communication, and the level of uncertainty created by missing HTTP/2 protocol, resource, route, and application lineage.
Low Impact Scenario
Rapid detection confirms attempted or low-volume HTTP/2 header, stream-reset, request-cancellation, protocol-error, or request-rejection activity against one or a small number of exposed routes. No sustained memory exhaustion is confirmed, no prolonged gateway instability occurs, no major customer-facing outage is observed, no regulated service is materially disrupted, and telemetry is sufficient to validate the source-to-route-to-resource chain quickly. Response is limited to SOC triage, proxy and WAF review, CDN or gateway tuning, route baseline validation, limited mitigation testing, and short-term monitoring; estimated impact $250K – $1.5M.
Moderate Impact Scenario
Confirmed or strongly suspected HTTP/2 resource-exhaustion activity causes intermittent degradation, gateway errors, memory pressure, worker exhaustion, backend retries, target-health changes, autoscaling surge, or limited customer-facing service interruption across business-critical web routes. The organization must treat the event as an application-delivery resilience incident even without confirmed compromise, data theft, ransomware, or persistent access. Response requires expanded proxy, CDN, WAF, load-balancer, API-gateway, ingress, service-mesh, cloud, Kubernetes, resource, and application telemetry review; emergency limit tuning; mitigation validation; customer-impact assessment; SOC surge activity; engineering support; executive reporting; and follow-on hardening of HTTP/2-facing infrastructure; estimated impact $2M – $10M.
High Impact Scenario
HTTP/2 resource-exhaustion activity becomes an enterprise-impact event when it causes prolonged or repeated customer-facing outage, degradation of authentication or payment workflows, API unavailability, SaaS front-end instability, multi-region edge failure, CDN-to-origin pressure, Kubernetes ingress instability, cloud autoscaling surge, material SLA exposure, revenue interruption, regulatory scrutiny, or broad loss of confidence in application-delivery resilience. The upper end of this range applies when the organization must sustain emergency mitigation, temporarily reduce HTTP/2 exposure, shift traffic across regions or providers, rebuild or reconfigure gateway and ingress layers, expand cloud capacity under pressure, conduct customer or regulator communications, support cyber-insurance or legal review, and validate that service instability did not mask follow-on host, identity, cloud, Kubernetes, or deployment-control-plane activity; estimated impact $12M – $60M+.
S6A — Key Cost Drivers
· Number and criticality of affected HTTP/2-enabled web servers, reverse proxies, API gateways, WAF nodes, load balancers, CDN origins, Kubernetes ingress controllers, service-mesh gateways, application front ends, routes, listeners, origins, tenants, and business services.
· Whether suspicious activity affects authentication paths, API routes, customer portals, payment workflows, SaaS front ends, regulated services, cloud ingress paths, Kubernetes ingress paths, service-mesh ingress paths, or revenue-generating digital workflows.
· Duration and severity of customer-facing degradation, including outage time, elevated latency, failed transactions, gateway errors, route-level unavailability, backend retry storms, origin withdrawal, target-health degradation, and user-facing error rates.
· Ability to reconstruct the activity path across HTTP/2 protocol telemetry, proxy logs, WAF logs, CDN logs, load-balancer logs, API-gateway logs, ingress logs, service-mesh logs, NDR telemetry, resource telemetry, cloud logs, Kubernetes events, application performance telemetry, and change-control records.
· Scope of emergency mitigation, including stream limits, header limits, connection limits, rate limits, timeout tuning, WAF rules, CDN protections, gateway circuit breakers, origin shielding, traffic shaping, autoscaling controls, and temporary HTTP/2 exposure reduction.
· Extent of cloud, CDN, WAF, logging, autoscaling, and infrastructure surge costs created by abnormal traffic, retry expansion, telemetry volume, response actions, or temporary capacity increases.
· Need for application, platform, cloud, Kubernetes, DevOps, network, SOC, incident-response, legal, customer-success, communications, and executive teams to coordinate investigation, mitigation, business-impact analysis, and recovery.
· Completeness and reliability of HTTP/2 protocol fields, frame-level diagnostics, route-to-service mapping, resource-to-route correlation, source attribution, client fingerprinting, timing normalization, and retention windows.
· Strength of approved baselines for HTTP/2 request volume, stream behavior, reset rates, cancellation rates, header-size distribution, request rejection, memory usage, worker utilization, route latency, backend retries, autoscaling activity, and gateway stability.
· Whether telemetry gaps force broader assurance work to determine whether service degradation was caused by malicious protocol abuse, legitimate traffic growth, deployment activity, failover, synthetic monitoring, vulnerability scanning, load testing, backend dependency failure, or application regression.
S6B — Compliance and Risk Context
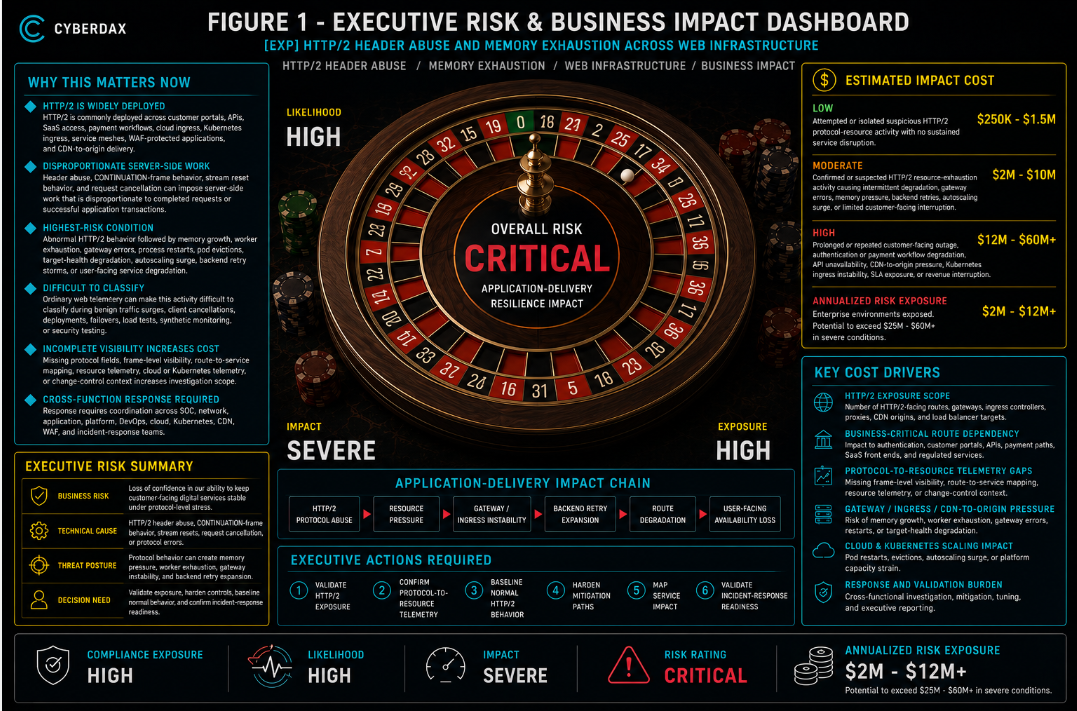
Figure 1
Compliance Exposure Indicator
High
Risk Register Entry
Risk Title
HTTP/2 Header Abuse and Web Infrastructure Memory-Exhaustion Exposure
Risk Description
Adversaries may abuse HTTP/2 header handling, CONTINUATION-frame behavior, stream resets, request cancellation, protocol errors, or request-rejection paths to create disproportionate server-side work, memory pressure, worker exhaustion, gateway instability, backend retry expansion, route degradation, or user-facing availability loss across exposed web infrastructure. This may reduce confidence in application-delivery resilience, customer-facing service availability, API reliability, payment workflow stability, cloud and Kubernetes ingress resilience, and the organization’s ability to distinguish malicious protocol-resource abuse from normal traffic, testing, deployment, or application-performance events.
Likelihood
High
Impact
Severe
Risk Rating
Critical
Annualized Risk Exposure
Estimated $2M – $12M+ for materially exposed enterprise environments with broad HTTP/2 dependency, business-critical web routes, customer-facing APIs, CDN-to-origin exposure, Kubernetes ingress dependency, incomplete HTTP/2 telemetry, limited route-to-service mapping, weak resource baselines, or limited change-control integration. Exposure may exceed $25M – $60M+ where prolonged or repeated outages affect authentication, payment, SaaS, regulated, or revenue-generating services; emergency mitigation requires broad HTTP/2 reconfiguration; telemetry gaps force extended incident validation; or customer, SLA, legal, regulatory, cyber-insurance, executive, and board-level response is required.
S7 — Risk Drivers
· HTTP/2-facing assets are often shared across multiple high-value business paths, which can turn a protocol-resource event into a broader application-delivery incident.
· Memory pressure, worker exhaustion, event-loop delay, file-descriptor pressure, queue growth, connection-table pressure, process restarts, pod evictions, target-health degradation, and origin withdrawal can convert protocol anomalies into visible service disruption.
· Distributed source activity, rare autonomous systems, unusual client fingerprints, abnormal TLS characteristics, low completion ratios, high reset ratios, and repeated request rejection increase concern when aligned with resource pressure or route degradation.
· Business exposure increases when affected paths support authentication, customer transactions, partner APIs, revenue-generating workflows, regulated services, operational dashboards, SaaS access, or production cloud and Kubernetes ingress.
· Missing HTTP/2 protocol fields, incomplete frame-level diagnostics, sampled CDN or WAF logs, weak route-to-service lineage, short retention, or inconsistent naming across routes, services, pods, origins, edge nodes, and application services can increase investigation scope and cost.
· Incomplete change-control records for load testing, performance testing, resilience testing, synthetic monitoring, vulnerability scanning, deployments, failovers, CDN changes, WAF changes, ingress updates, service-mesh updates, or HTTP/2 configuration changes can increase false positives and response burden.
· Limited ability to tune stream limits, header limits, connection limits, rate limits, gateway circuit breakers, WAF rules, CDN protections, origin shielding, autoscaling behavior, or traffic shaping can extend service degradation during active events.
· Cloud, CDN, WAF, logging, and autoscaling costs may increase materially during abnormal traffic, retry expansion, emergency mitigation, telemetry surge, or temporary capacity expansion.
· Suspicious host, file, identity, cloud, Kubernetes, or deployment-control-plane activity after an HTTP/2 resource-exhaustion event can expand the incident from availability response into compromise validation, even though protocol abuse alone does not prove durable access.
S8 — Bottom Line for Executives
HTTP/2 header abuse and memory exhaustion should be treated as a high-priority application-delivery resilience risk because it can degrade the public-facing infrastructure that supports revenue, access, transactions, customer trust, and regulated-service continuity. The executive question is not only whether a specific product or CVE is affected; it is whether the organization can prove that abnormal HTTP/2 behavior did or did not cause resource pressure, gateway instability, backend degradation, customer-facing errors, or material service interruption. Response must focus on validating HTTP/2 exposure, hardening header and stream controls, confirming protocol-to-resource-to-service telemetry, integrating change-control context, and ensuring suspected protocol-resource abuse can be contained before it becomes prolonged outage or broader uncertainty around web-delivery resilience.
S9 — Board-Level Takeaway
HTTP/2 header abuse and memory exhaustion turns web infrastructure into a board-level resilience and customer-trust issue. The risk is not simply malformed requests or elevated traffic; it is the possibility that normal protocol handling can be abused to exhaust memory, saturate workers, destabilize gateways, degrade critical APIs, disrupt customer access, pressure cloud or Kubernetes ingress, and create uncertainty around the availability of business-critical digital services. Leadership should require measurable assurance that HTTP/2-enabled services are inventoried, business-critical routes are mapped, telemetry can connect source behavior to protocol anomalies and service impact, mitigation controls are tested, operational baselines are maintained, change-control context is integrated, and response teams can rapidly distinguish malicious protocol-resource exhaustion from legitimate traffic, deployments, testing, failover, or application-performance incidents.
S10 — Threat Overview
HTTP/2 header abuse and memory exhaustion across web infrastructure describes adversary behavior intended to abuse HTTP/2 protocol handling in a way that creates disproportionate server-side work, memory pressure, worker exhaustion, gateway instability, backend retry expansion, or user-facing availability degradation. The behavior is most relevant when suspicious HTTP/2 header, CONTINUATION-frame, stream-reset, request-cancellation, protocol-error, or request-rejection activity affects exposed web servers, reverse proxies, API gateways, WAF-protected applications, load balancers, CDN origins, Kubernetes ingress controllers, service-mesh gateways, or customer-facing application front ends.
· This is not only a single-CVE, single-vendor, single-web-server, or generic DDoS model.
· The core threat behavior is protocol-resource abuse against HTTP/2-facing infrastructure where normal request handling can be forced into abnormal parsing, buffering, stream tracking, worker consumption, or memory allocation.
· The primary risk is loss of availability, degraded customer-facing performance, gateway instability, API disruption, authentication-path degradation, payment-workflow interruption, or broader uncertainty around application-delivery resilience.
· HTTP/2 protocol telemetry, proxy logs, WAF logs, CDN logs, load-balancer logs, API-gateway logs, ingress logs, service-mesh logs, resource telemetry, application telemetry, cloud telemetry, Kubernetes telemetry, and change-control evidence may be incomplete or difficult to reconcile during active service degradation.
· The behavior can create uncertainty around HTTP/2 exposure, route stability, gateway capacity, backend resilience, CDN-to-origin pressure, autoscaling behavior, customer impact, SLA exposure, and mitigation readiness.
· Current proof-point activity should support the relevance of the behavior class but should not narrow the report into a single-CVE, single-product, single-proof-of-concept, single-source, single-route, or single-error-code analysis.
S11 — Threat Classification and Type
Threat Type
HTTP/2 protocol-resource exhaustion and application-delivery availability exposure
Threat Sub-Type
HTTP/2 header abuse, CONTINUATION-frame abuse, incomplete header processing, stream-reset abuse, request-cancellation abuse, protocol-error concentration, header-limit pressure, frame-limit pressure, reverse-proxy instability, API-gateway degradation, CDN-to-origin pressure, ingress-controller exhaustion, service-mesh gateway pressure, and downstream application availability impact.
Operational Classification
Application-layer resource-exhaustion and web infrastructure resilience pathway
Primary Function
Exploit or abuse HTTP/2 protocol handling to create disproportionate server-side processing, buffering, memory allocation, stream tracking, worker consumption, request-queue growth, gateway instability, backend retry expansion, or route-level degradation that can affect customer-facing applications and business-critical web services.
S12 — Campaign or Activity Overview

Figure 2
This report assesses HTTP/2 header abuse and memory exhaustion across web infrastructure as a durable behavior class rather than a single campaign. The activity pattern involves adversaries attempting to abuse HTTP/2-facing request-handling paths where successful or suspected activity can affect memory utilization, worker availability, gateway stability, backend service pressure, cloud or Kubernetes scaling behavior, and customer-facing application availability.
· The activity is best understood as an application-delivery resilience threat rather than a simple malformed-request event, isolated web error, or ordinary traffic spike.
· Adversaries may target web servers, reverse proxies, API gateways, load balancers, WAF-protected applications, CDN origins, Kubernetes ingress controllers, service-mesh gateways, SaaS front ends, customer portals, authentication paths, API routes, payment workflows, or other HTTP/2-enabled entry points.
· The behavior may involve excessive header processing, abnormal CONTINUATION-frame behavior, incomplete header sequences, rapid stream resets, repeated request cancellation, high stream churn, protocol errors, header-limit events, frame-limit events, or request-rejection patterns.
· The activity may remain limited to suspicious protocol behavior, or it may progress into memory pressure, worker exhaustion, process restart, container restart, pod eviction, gateway timeout, target-health degradation, autoscaling surge, backend retry expansion, application latency, customer-facing errors, or service unavailability.
· The activity becomes highest risk when suspicious HTTP/2 behavior affects authentication, APIs, customer portals, payment workflows, SaaS front ends, CDN origins, cloud ingress, Kubernetes ingress, service-mesh ingress, or other business-critical service paths.
· The report should remain focused on durable protocol-resource exhaustion behavior and web infrastructure exposure rather than one exploit string, one CVE, one vendor log message, one source IP, one user agent, one route, one proof-of-concept, or one event ID.
S13 — Targets and Exposure Surface
The exposure surface includes HTTP/2-enabled web infrastructure, application-delivery layers, cloud ingress paths, Kubernetes ingress paths, service-mesh ingress gateways, CDN origins, WAF-protected applications, API front ends, and downstream services that depend on stable edge and gateway behavior.
· Internet-facing web servers, reverse proxies, API gateways, WAF nodes, load balancers, CDN origins, Kubernetes ingress controllers, service-mesh ingress gateways, and application front ends.
· Customer portals, authentication paths, API routes, payment workflows, SaaS front ends, administrative portals, partner APIs, regulated-service portals, and other business-critical web routes.
· HTTP/2-enabled listeners, virtual hosts, routes, origins, edge nodes, backend services, ingress resources, service-mesh routes, cloud load-balancer targets, and application services.
· CDN-to-origin, WAF-to-origin, load-balancer-to-origin, API-gateway-to-backend, ingress-to-service, and service-mesh-to-upstream communication paths.
· Web infrastructure processes, reverse-proxy workers, gateway workers, ingress-controller processes, service-mesh proxies, application workers, container workloads, pods, nodes, and cloud-hosted workloads that support HTTP/2-facing services.
· Resource and stability layers including memory, CPU, worker pools, thread pools, event loops, file descriptors, connection tables, queue depth, request backlog, autoscaling behavior, target-health state, and origin availability.
· Cloud, Kubernetes, container, monitoring, alerting, and application performance systems that provide evidence of scaling behavior, pod restarts, container evictions, target-health changes, backend latency, application errors, and user-facing degradation.
· Environments with incomplete HTTP/2 protocol fields, missing frame-level diagnostics, sampled CDN or WAF logs, weak route-to-service mapping, short retention, incomplete resource telemetry, inconsistent naming, or limited change-control context.
· Environments that depend heavily on HTTP/2-enabled customer access, high-volume API traffic, cloud-native ingress, Kubernetes ingress, service meshes, payment workflows, regulated portals, or SaaS delivery.
· Environments with limited ability to rapidly tune stream limits, header limits, connection limits, rate limits, WAF rules, CDN protections, gateway circuit breakers, origin shielding, autoscaling controls, traffic shaping, or temporary HTTP/2 exposure reduction.
S14 — Sectors / Countries Affected
Sectors Affected
· Technology and SaaS providers.
· Financial services and payment platforms.
· Healthcare and life sciences.
· Retail and e-commerce.
· Telecommunications and internet service providers.
· Cloud-native service providers and managed infrastructure providers.
· Media, streaming, and high-traffic digital platforms.
· Education and research institutions.
· Government and public-sector organizations.
· Energy, utilities, and critical infrastructure operators with customer-facing digital services.
· Legal, consulting, and professional services organizations with customer portals, APIs, or regulated digital workflows.
· Organizations with HTTP/2-enabled customer-facing applications, API gateways, CDN origins, Kubernetes ingress, service-mesh gateways, payment workflows, authentication services, SaaS platforms, or business-critical web delivery.
Countries Affected
· Global.
· Exposure is not limited to a single country or region because HTTP/2-enabled web infrastructure, CDNs, API gateways, cloud load balancers, Kubernetes ingress controllers, service meshes, and customer-facing web applications are broadly deployed across enterprise environments.
· Countries with large cloud-native operations, SaaS providers, financial systems, digital government services, e-commerce platforms, healthcare portals, telecommunications providers, or high-volume customer-facing APIs may face elevated operational exposure.
· Country-specific impact should be assessed by HTTP/2 exposure, customer-facing route dependency, business-critical web service footprint, cloud and Kubernetes ingress architecture, CDN-to-origin design, telemetry quality, mitigation maturity, and incident-response readiness rather than geography alone.
S15 — Adversary Capability Profiling
Capability Level
Moderate
Technical Sophistication
Adversaries require enough technical capability to understand HTTP/2 request handling, header processing, CONTINUATION-frame behavior, stream lifecycle behavior, request cancellation, protocol errors, reverse-proxy behavior, API-gateway behavior, CDN-to-origin paths, ingress-controller behavior, service-mesh behavior, and resource-exhaustion effects. Lower-complexity activity may involve noisy malformed requests or public proof-of-concept behavior. More capable activity may pace traffic, distribute sources, target sensitive routes, blend with normal client cancellation behavior, avoid simple volumetric thresholds, and time activity to complicate separation from deployments, failovers, synthetic monitoring, or legitimate traffic surges.
Infrastructure Maturity
Moderate
Infrastructure maturity varies by activity pattern. Lower-maturity activity may use obvious scanners, limited source infrastructure, repetitive request patterns, abnormal user agents, or noisy protocol errors. Higher-maturity activity may distribute HTTP/2 behavior across multiple sources, autonomous systems, client fingerprints, routes, edge nodes, or regions while keeping request rates below simple thresholds and relying on cumulative memory pressure, worker exhaustion, backend retry expansion, or route-level degradation.
Operational Scale
Single-route to multi-service enterprise exposure
Operational scale ranges from suspicious activity against one HTTP/2-enabled route or gateway to broader enterprise impact when attackers affect multiple edge nodes, regions, origins, API routes, customer portals, payment workflows, SaaS front ends, Kubernetes ingress paths, service-mesh gateways, or cloud load-balanced services.
Escalation Likelihood
Moderate to High
Escalation likelihood is moderate to high when suspicious HTTP/2 behavior affects business-critical routes, produces memory pressure, causes worker exhaustion, triggers gateway instability, creates backend retry expansion, degrades target health, causes autoscaling surge, or produces customer-facing service impact. Escalation likelihood increases when telemetry gaps prevent rapid source-to-route-to-resource correlation or when suspicious host, identity, cloud, Kubernetes, or deployment-control-plane activity appears after the HTTP/2 event.
S16 — Targeting Probability Assessment
Overall Targeting Probability
High
Targeting Drivers
· HTTP/2-enabled infrastructure is broadly deployed across internet-facing customer portals, APIs, SaaS platforms, payment workflows, cloud ingress paths, Kubernetes ingress paths, service meshes, CDNs, WAF-protected applications, and load-balanced services.
· Attackers benefit from protocol-resource abuse because it can degrade customer-facing services without requiring traditional malware deployment, credential theft, or durable host compromise.
· Public-facing reverse proxies, API gateways, CDN origins, load balancers, ingress controllers, service-mesh gateways, and application front ends provide high-value opportunities when HTTP/2 limits, telemetry, baselines, or mitigation paths are weak.
· Authentication paths, payment workflows, API routes, customer portals, SaaS access, partner integrations, regulated portals, and revenue-generating web services create high business impact when degraded.
· Missing HTTP/2 protocol visibility, incomplete frame-level diagnostics, weak route-to-service mapping, sampled CDN or WAF logs, incomplete resource telemetry, and short retention increase attacker opportunity and response uncertainty.
· Traffic that resembles browser cancellation, mobile-network instability, synthetic monitoring, vulnerability scanning, failover, deployment activity, or legitimate traffic surge can make malicious HTTP/2 resource abuse harder to classify quickly.
· Cloud, Kubernetes, CDN, WAF, autoscaling, and service-mesh dependencies can amplify cost and complexity when edge-tier protocol anomalies propagate into backend retries, target-health changes, pod restarts, scaling events, or application degradation.
· Organizations with limited runbooks for HTTP/2 resource-exhaustion events may need more time to tune limits, shape traffic, validate mitigations, and prove whether service degradation was malicious or operational.
Most Likely Targets
· HTTP/2-enabled web servers, reverse proxies, API gateways, WAF-protected applications, load balancers, CDN origins, Kubernetes ingress controllers, service-mesh ingress gateways, and application front ends.
· Customer-facing authentication routes, API routes, payment paths, customer portals, SaaS front ends, partner APIs, regulated-service portals, and high-value business workflows.
· CDN-to-origin paths, WAF-to-origin paths, load-balancer targets, API-gateway backends, ingress-to-service paths, service-mesh upstreams, and backend application services.
· Cloud-native and Kubernetes-heavy environments with exposed ingress controllers, autoscaling dependencies, route-to-service complexity, container memory limits, or service-mesh ingress paths.
· Organizations with incomplete HTTP/2 telemetry, weak route inventory, limited resource baselines, short retention, sampled edge logs, inconsistent service naming, weak change-control integration, or limited SOC access to application-delivery telemetry.
· High-volume digital platforms where degraded availability can affect revenue, customer trust, SLA commitments, regulated-service access, payment completion, customer onboarding, or business-critical API availability.
· Environments where HTTP/2 mitigation controls are untested, including stream limits, header limits, connection limits, rate limits, WAF rules, CDN protections, gateway circuit breakers, origin shielding, traffic shaping, autoscaling controls, or temporary HTTP/2 exposure reduction.
· Web infrastructure with limited separation between customer-facing routes, backend services, cloud load balancers, Kubernetes services, service-mesh routes, monitoring systems, and operational change records.
S17 — MITRE ATT&CK Chain Flow Mapping
Stage 1: Public HTTP/2 Entry-Point Targeting
The adversary directs activity at an exposed HTTP/2-enabled web server, reverse proxy, API gateway, load balancer, CDN origin, Kubernetes ingress controller, service-mesh gateway, or application front end. This mapping should be used when suspicious activity targets an internet-facing HTTP/2 service path.
· T1190 — Exploit Public-Facing Application.
Stage 2: HTTP/2 Header or Stream Handling Abuse
The adversary abuses HTTP/2 header handling, CONTINUATION-frame behavior, incomplete header processing, stream reset behavior, request cancellation, protocol errors, or request-rejection paths to force abnormal server-side parsing, buffering, stream tracking, or connection handling.
· T1499.004 — Endpoint Denial of Service: Application or System Exploitation.
Stage 3: Edge or Gateway Resource Exhaustion
The activity creates or contributes to memory pressure, worker exhaustion, CPU pressure, event-loop delay, queue growth, file-descriptor pressure, connection-table growth, process instability, container restart, pod eviction, or gateway instability on HTTP/2-facing infrastructure.
· T1499 — Endpoint Denial of Service.
Stage 4: Edge-Service Instability and Defensive Control Activation
The activity produces elevated gateway errors, upstream timeouts, target-health changes, origin-health events, connection resets, WAF activity, CDN protections, rate limits, stream limits, header limits, connection limits, gateway circuit breakers, origin shielding, autoscaling, traffic shaping, connection draining, or temporary HTTP/2 exposure reduction. This stage captures the defensive and operational response signals that appear as the resource-exhaustion event becomes visible.
· T1499 — Endpoint Denial of Service.
Stage 5: Downstream Service Degradation
The edge or gateway pressure propagates into backend retry expansion, route latency, dependency timeouts, application errors, autoscaling surge, target-health degradation, origin withdrawal, or user-facing availability loss affecting customer portals, APIs, authentication paths, payment workflows, SaaS access, or other business-critical services.
· T1499 — Endpoint Denial of Service.
Stage 6: Conditional Post-Event Host, Identity, Cloud, or Kubernetes Validation
This stage should be used only when suspicious administrative activity, unauthorized configuration change, credential use, cloud activity, Kubernetes activity, deployment-control-plane activity, or host-side execution appears after the HTTP/2 event and can be tied to affected infrastructure. It should not be inferred from denial-of-service or resource-exhaustion activity alone.
· T1078 — Valid Accounts.
Stage 7: Application-Delivery Trust and Business Impact Expansion
The organization may need to treat the event as a broader application-delivery resilience incident when protocol behavior, source context, route lineage, resource pressure, application impact, mitigation activity, and change-control context cannot be validated quickly. This stage represents operational impact and response expansion rather than a separate adversary technique.
· No additional ATT&CK technique; continuation of T1499 impact.
S18 — Attack Path Narrative (Signal-Aligned Execution Flow)
HTTP/2 header abuse and memory exhaustion across web infrastructure begins when an adversary directs abnormal HTTP/2 activity at exposed web delivery infrastructure that terminates, proxies, inspects, routes, or supports customer-facing traffic. The attacker’s objective is to force disproportionate server-side work through HTTP/2 header processing, CONTINUATION-frame behavior, stream lifecycle manipulation, request cancellation, protocol-error generation, or request-rejection pressure. The attack path is defined by exposed HTTP/2 service targeting, protocol-handling abuse, edge or gateway resource exhaustion, edge-service instability and defensive-control activation, downstream service degradation, conditional post-event validation, and broader application-delivery trust impact.
Stage 1: Public HTTP/2 Entry-Point Targeting
The adversary directs activity at an internet-facing HTTP/2-enabled service path, including a web server, reverse proxy, API gateway, WAF-protected application, load balancer, CDN origin, Kubernetes ingress controller, service-mesh gateway, or application front end. Targeting an exposed route is not meaningful by itself because normal customer traffic, synthetic monitoring, vulnerability scanning, and partner integrations may contact the same infrastructure. It becomes material when the activity shows abnormal source behavior, unusual client fingerprinting, repeated protocol errors, sensitive route concentration, or timing that does not align with approved operational activity.
Stage 2: HTTP/2 Header or Stream Handling Abuse
The adversary abuses HTTP/2 request-handling behavior through excessive header processing, abnormal CONTINUATION-frame sequences, incomplete header completion, high stream churn, rapid stream resets, repeated request cancellation, header-limit pressure, frame-limit pressure, protocol-error concentration, or request-rejection patterns. This stage changes the event from ordinary web traffic into potential protocol-resource abuse. The key signal is not one malformed request, oversized header, reset, or error code by itself; it is repeated or concentrated HTTP/2 behavior that forces abnormal parsing, buffering, stream tracking, connection handling, or request-processing work.
Stage 3: Edge or Gateway Resource Exhaustion
The abnormal HTTP/2 behavior creates or aligns with memory pressure, CPU pressure, worker exhaustion, thread-pool saturation, event-loop delay, queue growth, file-descriptor pressure, connection-table growth, request-backlog expansion, process instability, service restart, container restart, pod eviction, node pressure, or out-of-memory behavior. This stage is where protocol abuse becomes operationally significant because the affected infrastructure begins showing measurable resource stress. Confidence increases when the resource pressure can be tied to the affected route, listener, edge node, gateway process, container, pod, origin, or service within a plausible timing window.
Stage 4: Edge-Service Instability and Defensive Control Activation
As resource pressure increases, reverse proxies, API gateways, WAF layers, CDN origins, load balancers, ingress controllers, service-mesh gateways, or application front ends may produce elevated 400, 413, 431, 499, 502, 503, 504, upstream timeout, gateway timeout, protocol-error, stream-reset, target-health, or origin-health events. Defensive or operational controls may also activate, including WAF rules, CDN protections, rate limits, stream limits, header limits, connection limits, gateway circuit breakers, origin shielding, autoscaling, traffic shaping, connection draining, or temporary HTTP/2 exposure reduction. This stage should be evaluated carefully because similar signals can appear during deployments, failovers, load tests, synthetic monitoring, vulnerability scanning, backend dependency failures, or legitimate traffic growth.
Stage 5: Downstream Service Degradation
If the edge or gateway layer cannot absorb the pressure, the activity may propagate into backend retry expansion, upstream timeout growth, route-level latency, application errors, dependency timeouts, backend saturation, autoscaling surge, target-health degradation, origin withdrawal, customer-facing errors, or service unavailability. This stage creates the clearest business impact because the activity can affect authentication, API availability, customer portals, payment workflows, SaaS access, partner integrations, regulated service access, or other business-critical digital services. The organization must determine whether the degradation aligns with suspicious HTTP/2 protocol behavior or whether it is better explained by operational change, backend failure, infrastructure scaling, monitoring activity, or normal demand.
Stage 6: Conditional Post-Event Host, Identity, Cloud, or Kubernetes Validation
After the availability event, suspicious activity may appear on affected infrastructure or related control planes, including unexpected shell execution, diagnostic tooling, unauthorized configuration change, secret access, credential use, cloud API activity, Kubernetes API activity, deployment-control-plane interaction, service restart, emergency mitigation, or incident-response action. This stage should remain conditional and should not be inferred from denial-of-service or resource-exhaustion behavior alone. It becomes relevant only when user, process, identity, host, workload, route, cloud, Kubernetes, timestamp, or incident-response lineage supports a connection to the affected HTTP/2 infrastructure.
Stage 7: Application-Delivery Trust and Business Impact Expansion
When protocol behavior, source context, route lineage, resource pressure, mitigation activity, application impact, and change-control context cannot be validated quickly, the organization may need to treat the event as a broader application-delivery resilience incident. Response can expand into HTTP/2 exposure review, route inventory validation, proxy and gateway tuning, WAF and CDN mitigation, cloud and Kubernetes scaling review, ingress-controller hardening, service-mesh review, application performance analysis, customer-impact assessment, legal review, executive reporting, and longer-term telemetry improvement. Business impact increases because responders must prove both what caused the service degradation and whether exposed web infrastructure remained resilient during the activity window.
S19 — Attack Chain Risk Amplification Summary
HTTP/2 header abuse and memory exhaustion amplifies risk because it targets the public-facing infrastructure that customers, APIs, applications, cloud ingress paths, Kubernetes ingress controllers, service meshes, and business-critical digital workflows already depend on. The chain becomes materially more dangerous when suspicious HTTP/2 behavior is followed by resource pressure, gateway instability, defensive-control activation, backend retry expansion, route degradation, autoscaling surge, customer-facing errors, or inability to prove whether service impact was malicious or operational.
· Exposed HTTP/2 entry points create a high-value pathway because they sit in front of customer portals, APIs, SaaS front ends, payment workflows, CDN origins, cloud ingress paths, Kubernetes ingress paths, and service-mesh gateways.
· HTTP/2 header, CONTINUATION-frame, stream-reset, and request-cancellation behavior increases risk when it creates disproportionate server-side work relative to completed requests or successful application transactions.
· Memory pressure, worker exhaustion, CPU pressure, event-loop delay, queue growth, file-descriptor pressure, connection-table growth, process instability, pod eviction, or out-of-memory behavior turns protocol activity into infrastructure-impacting resource pressure.
· Reverse-proxy errors, WAF anomalies, CDN-to-origin errors, API-gateway failures, load-balancer target-health degradation, ingress-controller instability, service-mesh retry expansion, and gateway timeouts increase concern when aligned with abnormal HTTP/2 behavior.
· Defensive-control activation can increase operational complexity when rate limits, stream limits, header limits, connection limits, WAF rules, CDN protections, circuit breakers, traffic shaping, autoscaling, or temporary HTTP/2 exposure reduction must be tuned during an active service event.
· Downstream retry storms, backend latency, dependency timeouts, autoscaling surge, application errors, and user-facing degradation expand the incident from edge-layer anomaly into business-service exposure.
· Authentication routes, API routes, payment workflows, customer portals, SaaS front ends, regulated-service portals, and business-critical application paths increase the severity of otherwise similar HTTP/2 resource-exhaustion behavior.
· Distributed source activity, rare autonomous systems, abnormal TLS or client fingerprints, unusual user agents, high reset ratios, low completion ratios, or repeated request rejection increase concern when aligned with resource pressure or route impact.
· Incomplete HTTP/2 protocol fields, missing frame-level diagnostics, sampled CDN or WAF logs, weak route-to-service mapping, incomplete resource telemetry, short retention, or inconsistent naming can force broader validation because the organization cannot quickly prove service-impact lineage.
· Change-control gaps increase false-positive and response burden when load testing, synthetic monitoring, vulnerability scanning, deployments, failovers, CDN changes, WAF changes, ingress updates, service-mesh updates, or HTTP/2 configuration changes cannot be ruled in or out.
· Response burden increases because teams must validate protocol behavior, source context, route lineage, resource state, edge-service stability, mitigation activity, application impact, customer exposure, and any conditional post-event host, identity, cloud, or Kubernetes activity.
S20 — Tactics, Techniques, and Procedures

Figure 3
HTTP/2 Entry-Point Targeting
Adversaries may direct activity at exposed HTTP/2-enabled web servers, reverse proxies, API gateways, WAF-protected applications, load balancers, CDN origins, Kubernetes ingress controllers, service-mesh gateways, customer portals, authentication paths, API routes, payment workflows, SaaS front ends, or other business-critical application paths. This behavior becomes risk-relevant when route sensitivity, source behavior, timing, client fingerprinting, error patterns, or operational context does not match normal traffic.
Header and CONTINUATION-Frame Pressure
Adversaries may attempt to force abnormal server-side work through excessive header processing, CONTINUATION-frame sequences, incomplete header completion, header-limit pressure, frame-limit pressure, HPACK-related stress, protocol errors, or request-rejection patterns. This activity should be evaluated against normal header-size distribution, header-count distribution, route behavior, client class, HTTP/2 implementation, proxy behavior, and resource impact.
Stream Reset and Request Cancellation Abuse
Adversaries may use rapid stream resets, repeated request cancellation, high stream churn, incomplete stream behavior, or low completed-request ratios to create server-side work without corresponding successful application transactions. This behavior should not be treated as malicious from one reset or cancellation event; it becomes material when abnormal rate, source context, route targeting, protocol evidence, and resource pressure align.
Edge and Gateway Resource Exhaustion
Adversaries may create or contribute to memory pressure, worker exhaustion, CPU pressure, event-loop delay, queue growth, file-descriptor pressure, connection-table growth, request-backlog expansion, process instability, service restarts, container restarts, pod evictions, node pressure, or out-of-memory behavior on HTTP/2-facing infrastructure. This activity becomes high risk when it aligns with suspicious protocol behavior and affects business-critical routes.
Edge-Service Instability and Control Activation
Adversaries may force visible instability or defensive activation across reverse proxies, WAF layers, CDNs, load balancers, API gateways, ingress controllers, service meshes, or application front ends. Relevant signals include gateway errors, upstream timeouts, target-health changes, origin withdrawal, WAF enforcement, CDN protection activation, rate limiting, stream limiting, header limiting, connection limiting, circuit breakers, origin shielding, autoscaling, traffic shaping, connection draining, or temporary HTTP/2 exposure reduction.
Service-Impact Propagation
Adversaries may cause edge-tier pressure to propagate into CDN-to-origin errors, WAF-to-origin errors, load-balancer target-health degradation, API-gateway failures, ingress-controller instability, service-mesh retry expansion, backend saturation, route latency, upstream timeouts, autoscaling surge, application errors, or customer-facing availability loss. This behavior should be tied to route, service, origin, pod, workload, or backend lineage before being attributed to HTTP/2 resource abuse.
Operational Blending
Adversaries may blend HTTP/2 resource-exhaustion behavior into normal browser cancellation, mobile-network instability, partner traffic, high-volume customer usage, synthetic monitoring, vulnerability scanning, performance testing, resilience testing, deployment windows, failover activity, or traffic growth. This behavior is effective because web infrastructure routinely produces resets, rejected requests, timeouts, autoscaling events, restarts, and intermittent gateway errors during legitimate operations.
Conditional Post-Event Activity
Adversaries may attempt follow-on activity only if an underlying weakness, exposed credential, administrative path, or control-plane opportunity exists. Relevant signals include suspicious shell execution, unauthorized configuration changes, credential use, secret access, cloud API activity, Kubernetes API activity, deployment-control-plane interaction, or unexpected administrative behavior after the HTTP/2 event. This behavior should remain conditional unless host, identity, process, cloud, Kubernetes, timing, or incident-response evidence supports the connection.
S20A — Adversary Tradecraft Summary
HTTP/2 header abuse and memory exhaustion targets application-delivery resilience rather than durable access by default. The adversary objective is to abuse normal protocol handling in a way that forces disproportionate work on exposed web infrastructure, degrades customer-facing services, pressures backend systems, activates mitigation controls, or creates uncertainty around the cause of service instability. The tradecraft is effective because it can resemble normal HTTP/2 client behavior, browser cancellation, mobile-network instability, high-volume traffic, synthetic monitoring, vulnerability scanning, load testing, deployment activity, or failover behavior while still creating meaningful resource and availability impact.
· The core tradecraft pattern is suspicious HTTP/2 protocol behavior followed by edge or gateway resource pressure, defensive-control activation, and downstream service impact.
· The behavior is not dependent on a single CVE, product, exploit string, source IP, user agent, route name, error code, proof-of-concept, or vendor event.
· Adversaries may use excessive header processing, CONTINUATION-frame behavior, incomplete header sequences, rapid stream resets, request cancellation, protocol errors, header-limit pressure, frame-limit pressure, request rejection, or distributed source behavior.
· The strongest operational risk occurs when suspicious HTTP/2 behavior affects authentication, APIs, customer portals, payment workflows, SaaS front ends, CDN origins, cloud ingress, Kubernetes ingress, service-mesh ingress, or other business-critical service paths.
· Detection requires visibility into both the HTTP/2 protocol behavior that initiates the chain and the resource, edge-service, mitigation, application, cloud, Kubernetes, and operational-context evidence that confirms or disproves impact.
· Response requires treating suspected HTTP/2 resource exhaustion as an application-delivery resilience incident, not a routine web error, isolated malformed request, or generic DDoS alert.
· The behavior remains durable because the adversary objective is to convert normal protocol handling into resource pressure and service degradation, regardless of the specific HTTP/2 implementation, reverse proxy, gateway, CDN, WAF, ingress controller, service mesh, source infrastructure, route, timing, or tooling used.
S21 — Detection Strategy Overview
Detection Philosophy
HTTP/2 header abuse and memory exhaustion across web infrastructure should be detected as a protocol-layer resource-exhaustion and edge-service stability problem, not as a single CVE, single vendor condition, single endpoint alert, or generic volumetric DDoS event. The detection model must correlate HTTP/2 header processing, CONTINUATION-frame behavior, stream cancellation, connection-level pressure, reverse-proxy instability, gateway resource exhaustion, ingress-controller degradation, application latency, and downstream service impact.
The primary detection objective is to identify when an attacker abuses HTTP/2 protocol behavior to force disproportionate server-side work, memory allocation, header buffering, stream tracking, worker consumption, request-queue growth, or service instability across web infrastructure.
Detection should prioritize chained behavior over isolated web errors. A large header block, malformed request, stream reset, 400 response, 413 response, 431 response, 499 response, gateway timeout, proxy restart, or memory spike may be benign when observed alone. Detection value increases when these events occur together, affect HTTP/2-enabled entry points, originate from abnormal source patterns, align with memory or worker pressure, and produce service degradation.
Primary Detection Anchors
· Excessive HTTP/2 HEADERS or CONTINUATION-frame activity against internet-facing web servers, reverse proxies, API gateways, load balancers, WAF-protected applications, service meshes, Kubernetes ingress controllers, CDN origins, or application front ends.
· CONTINUATION-frame sequences that delay or avoid header completion, especially where END_HEADERS is absent, repeatedly deferred, or associated with memory growth.
· HTTP/2 request cancellation, stream reset, or rapid stream churn behavior that creates high server-side work with low request-completion value.
· Abnormal reset-to-completed-request ratios, incomplete stream ratios, or request cancellation rates across HTTP/2 connections.
· Header-size, header-count, pseudo-header, HPACK, frame-size, or protocol-error patterns that align with excessive parsing, buffering, rejection, or connection handling.
· Repeated 400, 413, 431, 499, 502, 503, 504, upstream timeout, stream reset, protocol error, header-limit, frame-limit, or connection-reset events concentrated on HTTP/2-enabled routes.
· Memory growth, CPU pressure, worker exhaustion, thread-pool saturation, file-descriptor pressure, queue-depth increase, connection-table growth, event-loop pressure, or request-backlog growth on HTTP/2-enabled infrastructure.
· Web server, reverse proxy, load balancer, gateway, ingress-controller, service-mesh, container, or pod crash, restart, eviction, health-check failure, or origin withdrawal during abnormal HTTP/2 activity.
· Downstream application degradation following HTTP/2 edge anomalies, including increased API latency, retry storms, backend saturation, dependency timeouts, autoscaling surges, or user-facing availability loss.
Detection Prioritization Model
Detection should prioritize exposed infrastructure that terminates, proxies, inspects, or routes HTTP/2 traffic. The highest-value coverage applies to systems in front of authentication paths, customer portals, API gateways, SaaS front ends, payment workflows, cloud ingress paths, Kubernetes ingress controllers, service-mesh ingress gateways, CDN origins, and business-critical applications.
Highest-priority detections should require a correlation chain showing abnormal HTTP/2 protocol behavior followed by resource pressure, service instability, protective-control activation, or user-facing degradation.
High-Priority Detection Conditions
· Excessive CONTINUATION-frame behavior followed by memory growth, worker exhaustion, process restart, container restart, pod eviction, gateway reset, or availability degradation.
· Rapid HTTP/2 stream reset or request cancellation behavior followed by CPU pressure, connection saturation, queue growth, edge-tier instability, or service degradation.
· Header-limit, frame-limit, protocol-error, malformed-header, or oversized-header events concentrated by source, user agent, autonomous system, route, virtual host, listener, edge node, or application.
· HTTP/2 behavior that produces disproportionate server-side cost compared with request completion, response volume, or successful application transactions.
· Abnormal HTTP/2 activity affecting authentication routes, API routes, customer-facing portals, payment paths, CDN origins, Kubernetes ingress controllers, or service-mesh ingress gateways.
· Multiple web delivery tiers showing related instability, including WAF anomalies, CDN-to-origin errors, proxy errors, gateway timeouts, origin health failures, container restarts, autoscaling activity, and backend latency increases.
· Distributed source infrastructure producing similar HTTP/2 header, continuation, stream-reset, or cancellation behavior across multiple edge nodes, regions, origins, routes, or services.
Medium-priority detections should identify suspicious but incomplete chains requiring analyst review, enrichment, or additional telemetry.
Medium-Priority Detection Conditions
· Elevated HTTP/2 protocol errors without confirmed memory pressure or service impact.
· Increased 400, 413, 431, 499, 502, 503, or 504 responses from HTTP/2-enabled services without confirmed resource-exhaustion behavior.
· Unusual header-size distribution, header-count distribution, reset frequency, request rejection, or connection reuse affecting a sensitive route.
· Increased reverse-proxy, gateway, ingress-controller, or service-mesh worker pressure during a traffic surge not yet confirmed as malicious.
· Low-volume HTTP/2 anomalies consistent with scanning, security testing, misconfigured clients, synthetic monitoring, or vulnerability research.
Low-priority detections should remain hunting-only unless correlated with additional signals.
Low-Priority Detection Conditions
· Isolated oversized-header rejection from known clients, partner integrations, monitoring tools, vulnerability scanners, or approved testing systems.
· Normal HTTP/2 stream resets caused by browser behavior, mobile clients, user navigation, client-side cancellation, network instability, or benign retry logic.
· Planned load testing, performance testing, failover testing, resilience testing, or synthetic monitoring against HTTP/2 endpoints.
· Routine deployment rollouts, autoscaling events, proxy restarts, gateway restarts, ingress updates, service-mesh changes, or maintenance windows with approved change-control context.
Correlation Strategy (Strict Enforcement)
Detection logic must avoid treating a single HTTP error, oversized header, stream reset, protocol error, proxy warning, process restart, or memory spike as confirmed malicious activity. The required model is multi-signal correlation across HTTP/2 protocol behavior, source behavior, edge-service telemetry, resource state, service availability, and change-control context.
A high-confidence detection should include at least two signal categories. Confidence increases when three or more categories appear in sequence.
Required Correlation Categories
· HTTP/2 protocol signal, such as excessive CONTINUATION frames, incomplete header sequences, abnormal HEADERS activity, high stream churn, rapid stream resets, repeated request cancellation, protocol errors, header-limit events, frame-limit events, or HTTP/2-specific request rejection.
· Source-behavior signal, such as repeated activity from a single source, distributed source coordination, rare autonomous systems, abnormal user agents, unusual TLS or client fingerprinting, abnormal connection reuse, high reset-to-completion ratio, or source behavior inconsistent with normal client populations.
· Edge-service signal, such as reverse-proxy warnings, WAF anomalies, CDN-to-origin errors, ingress-controller errors, gateway worker saturation, connection-table pressure, request-queue growth, origin withdrawal, upstream retry expansion, or service-mesh error propagation.
· Resource-exhaustion signal, such as memory growth, CPU pressure, worker exhaustion, thread-pool saturation, file-descriptor pressure, event-loop delay, container memory pressure, pod eviction, process restart, crash loop, or host-level out-of-memory behavior.
· Availability signal, such as elevated 502, 503, 504, upstream timeout, health-check failure, route degradation, API latency increase, backend saturation, autoscaling surge, or user-facing error increase.
· Change-control signal, such as absence of approved load testing, performance testing, resilience testing, security testing, deployment activity, failover activity, CDN change, WAF tuning, ingress rollout, service-mesh update, or HTTP/2 configuration change during the event window.
Correlation must preserve infrastructure lineage. Analyst review should connect the source, client fingerprint, edge node, listener, virtual host, route, protocol version, HTTP/2 connection, stream behavior, gateway process, container, pod, host, upstream service, affected application, and business service wherever telemetry permits.
Correlation must also preserve timing. The highest-value chains are those where abnormal HTTP/2 header, CONTINUATION-frame, reset, or cancellation behavior is followed by memory growth, worker saturation, gateway errors, origin instability, downstream latency, protective-control activation, or service unavailability within a plausible operational window.
Telemetry Prioritization
Telemetry collection should prioritize HTTP/2-aware edge, proxy, gateway, ingress, service-mesh, and application-delivery visibility before attempting broad endpoint-only or network-only detection.
Priority Telemetry Sources
· Reverse-proxy, web-server, CDN, load-balancer, WAF, API-gateway, ingress-controller, service-mesh, and application-front-end logs that expose HTTP protocol version, method, route, host, status, response time, bytes, upstream result, request rejection, connection context, and error reason where available.
· HTTP/2 frame-level or protocol diagnostic telemetry where available, including HEADERS frames, CONTINUATION frames, RST_STREAM frames, stream lifecycle, header completion behavior, protocol errors, frame-size errors, and connection-level resets.
· Web infrastructure resource telemetry for memory, CPU, worker utilization, thread-pool saturation, event-loop delay, queue depth, file descriptors, connection counts, request backlog, process restarts, pod restarts, container evictions, and out-of-memory events.
· Network telemetry for source concentration, connection rate, TLS session behavior, destination service, byte counts, request-to-response imbalance, autonomous system, geolocation, proxy path, and distributed source patterns.
· Application performance telemetry for route latency, upstream retries, backend saturation, dependency timeouts, service errors, queue expansion, autoscaling events, and health-check failures.
· Cloud, Kubernetes, and container telemetry for ingress-controller behavior, pod restarts, memory limits, eviction events, node pressure, horizontal pod autoscaler activity, load-balancer target health, and service availability.
· Identity, change-control, and operational telemetry for load testing, performance testing, resilience testing, security testing, deployment rollouts, maintenance windows, CDN changes, WAF changes, service-mesh updates, ingress updates, and HTTP/2 configuration changes.
Endpoint telemetry should focus first on systems that terminate, proxy, inspect, or route HTTP/2 traffic, including reverse proxies, web servers, API gateways, ingress controllers, service-mesh ingress gateways, CDN origins, load-balancer targets, WAF nodes, and application front ends.
Detection Design Constraints
Detection content must distinguish malicious HTTP/2 resource-exhaustion behavior from normal web traffic, client cancellation behavior, browser behavior, mobile-network instability, load testing, monitoring, search indexing, vulnerability scanning, deployment activity, and legitimate high-volume customer usage. HTTP/2-enabled infrastructure is designed for multiplexing and connection reuse, so detections must account for normal stream resets, incomplete requests, retries, and traffic bursts.
The detection model should not assume that every oversized header, malformed request, stream reset, HTTP/2 protocol error, 413 response, 431 response, gateway timeout, or proxy warning is malicious. It should require supporting context such as abnormal rate, repeated source behavior, concentrated route targeting, protocol-specific frame anomalies, memory growth, worker exhaustion, edge-service instability, or downstream availability impact.
The detection model should not assume that every memory spike, proxy restart, container eviction, pod restart, autoscaling event, health-check failure, or upstream timeout indicates HTTP/2 exploitation. Instability signals are useful only when they align with suspicious HTTP/2 header, continuation, stream, reset, cancellation, source, or request-rejection behavior.
The detection model should not attribute downstream application degradation to HTTP/2 header abuse unless the affected route, gateway, listener, origin, pod, service, or backend can be tied to abnormal HTTP/2 activity through timing, source, protocol, connection, stream, infrastructure, or telemetry lineage.
The detection model should avoid IOC-led logic as the primary approach. Source IPs, autonomous systems, user agents, payload fragments, domains, scanner names, proof-of-concept names, and CVE identifiers may support enrichment and retrospective scoping, but the durable detection model must remain behavior-led.
Baseline and Deployment Requirements
Organizations should baseline normal HTTP/2 protocol behavior, header behavior, stream behavior, source behavior, edge-service resource patterns, and application availability before enabling high-severity alerting.
Required Baselines
· Normal HTTP/2 request volume, connection reuse, stream count, stream reset rate, request cancellation rate, request completion ratio, and request duration by application, route, listener, edge tier, and client class.
· Expected header-size distribution, header-count distribution, pseudo-header behavior, request rejection rate, 400 rate, 413 rate, 431 rate, 499 rate, and protocol-error rate by application and route.
· Expected memory, CPU, worker utilization, thread-pool behavior, file-descriptor usage, queue depth, connection count, request backlog, and restart behavior for HTTP/2-enabled infrastructure.
· Approved source populations, autonomous systems, geographies, user agents, partner integrations, CDN paths, synthetic monitoring systems, load-testing tools, vulnerability scanners, and security-testing systems.
· Expected CDN, WAF, reverse-proxy, API-gateway, ingress-controller, service-mesh, load-balancer, and origin behavior during normal traffic, peak traffic, deployments, maintenance, and failover windows.
· Normal backend latency, upstream retry behavior, health-check status, autoscaling activity, pod restart frequency, container memory pressure, and application error rates.
· Approved load testing, resilience testing, performance testing, security testing, deployment, maintenance, CDN change, WAF change, ingress change, service-mesh change, and HTTP/2 configuration change windows.
Deployment should begin in hunt or medium-severity alert mode until local schema mapping, field validation, parser behavior, frame visibility, resource baselines, exception handling, and false-positive review are complete.
High-severity alerting should require confirmed correlation across HTTP/2 protocol anomalies, source behavior, resource pressure, edge-tier instability, availability degradation, and absence of approved change-control context.
Variant Resilience Requirements
Detection must remain resilient across different HTTP/2 implementations, reverse proxies, web servers, API gateways, load balancers, WAFs, CDNs, service meshes, ingress controllers, application frameworks, and cloud hosting models. The detection model should not depend on a single product-specific log field, CVE identifier, proof-of-concept name, source address, user agent, route name, or vendor event name.
Variant-Resilient Detection Objectives
· Force HTTP/2 endpoints to parse, buffer, or process excessive header data.
· Abuse CONTINUATION-frame behavior, header completion behavior, HPACK processing paths, stream reset behavior, or request cancellation behavior.
· Create disproportionate server-side work relative to completed requests or useful application transactions.
· Concentrate resource pressure on internet-facing edge infrastructure, API gateways, reverse proxies, ingress controllers, service meshes, WAF nodes, load balancers, or CDN origins.
· Create memory growth, CPU pressure, worker exhaustion, queue expansion, connection pressure, event-loop delay, or process instability.
· Trigger gateway errors, upstream retries, origin instability, health-check failures, autoscaling events, or application availability degradation.
· Blend protocol abuse into normal HTTP/2 client behavior, browser cancellation patterns, mobile-network instability, or high-volume traffic surges.
Detection should support platform-specific field mapping for NGINX, Apache HTTP Server, Envoy, HAProxy, cloud load balancers, CDN logs, WAF logs, API gateways, Kubernetes ingress controllers, service-mesh gateways, application servers, container platforms, AWS, Azure, and GCP without changing the underlying behavior model.
Operational Detection Model
The operational model should use tiered escalation based on the number, sequence, sensitivity, and operational impact of correlated signals.
Initial hunting should identify HTTP/2-enabled entry points, routes, listeners, origins, proxies, ingress controllers, service-mesh gateways, API gateways, and applications with abnormal header, stream, reset, continuation, resource, or availability behavior. Medium-confidence detections should alert when suspicious HTTP/2 protocol behavior affects sensitive or internet-facing infrastructure and aligns with early resource or error indicators. High-confidence detections should alert when suspicious HTTP/2 behavior is followed by memory pressure, worker exhaustion, crash or restart events, gateway instability, downstream service degradation, or broad availability impact.
Operational Triage Questions
· Which HTTP/2-enabled edge service, virtual host, listener, route, origin, ingress controller, API gateway, service mesh, WAF layer, CDN path, or application was affected?
· What source infrastructure, autonomous systems, user agents, client fingerprints, geographies, or proxy paths generated the abnormal activity?
· Did the activity involve excessive CONTINUATION frames, incomplete header sequences, abnormal HEADERS activity, rapid stream resets, high stream churn, request cancellation, or HTTP/2 protocol errors?
· Did the affected infrastructure show memory growth, CPU pressure, worker exhaustion, thread-pool saturation, file-descriptor pressure, queue growth, connection-table pressure, process restart, pod restart, container eviction, or out-of-memory behavior?
· Did edge-tier instability produce 400, 413, 431, 499, 502, 503, 504, upstream timeout, health-check failure, origin withdrawal, autoscaling surge, or user-facing service degradation?
· Was the activity expected under approved load testing, resilience testing, performance testing, synthetic monitoring, vulnerability scanning, deployment, failover, CDN change, WAF change, ingress update, service-mesh update, or HTTP/2 configuration change?
· Did the affected path involve authentication, customer portals, APIs, payment workflows, SaaS front ends, cloud ingress, Kubernetes ingress, service-mesh ingress, or other business-critical application paths?
· Is the same HTTP/2 behavior visible across multiple edge nodes, regions, origins, applications, tenants, routes, or service tiers?
· Did mitigation controls activate, including WAF rules, CDN protections, rate limits, connection limits, stream limits, header limits, gateway circuit breakers, autoscaling, origin shielding, or traffic shaping?
· Can the event be reconstructed from source behavior through HTTP/2 protocol anomalies, edge-service resource pressure, downstream availability impact, and response actions?
The detection model should support both real-time alerting and retrospective threat hunting. Retrospective hunting is especially important when frame-level telemetry, proxy logs, WAF logs, CDN logs, resource telemetry, Kubernetes events, cloud load-balancer logs, and application performance data are retained separately or when service degradation is discovered before protocol-layer abuse is confirmed.
S22 — Primary Detection Signals
Primary Detection Signals
Primary detection should focus on HTTP/2 protocol behavior, edge-service instability, resource-exhaustion indicators, source behavior, and downstream application impact. These signals provide the strongest foundation for identifying HTTP/2 header abuse and memory-exhaustion activity because they show whether protocol handling is creating abnormal server-side work, memory pressure, worker saturation, gateway degradation, or user-facing service impact.
High-Value Primary Signals
· Excessive HTTP/2 HEADERS or CONTINUATION-frame activity against internet-facing web servers, reverse proxies, API gateways, load balancers, WAF-protected applications, service meshes, Kubernetes ingress controllers, CDN origins, or application front ends.
· CONTINUATION-frame sequences that delay, defer, or fail to complete header processing, especially where END_HEADERS is absent, delayed, or associated with abnormal memory growth.
· HTTP/2 request cancellation, stream reset, or rapid stream churn behavior that creates disproportionate server-side work compared with completed requests or successful application transactions.
· Abnormal reset-to-completed-request ratios, incomplete stream ratios, connection reuse patterns, or request-cancellation rates across HTTP/2 connections.
· Header-size, header-count, pseudo-header, HPACK, frame-size, or protocol-error patterns that align with excessive parsing, buffering, rejection, or connection handling.
· Concentrated 400, 413, 431, 499, 502, 503, 504, upstream timeout, stream reset, protocol error, header-limit, frame-limit, or connection-reset events on HTTP/2-enabled routes.
· Memory growth, CPU pressure, worker exhaustion, thread-pool saturation, file-descriptor pressure, queue-depth increase, connection-table growth, event-loop delay, or request-backlog growth on HTTP/2-enabled infrastructure.
· Web server, reverse proxy, load balancer, gateway, ingress-controller, service-mesh, container, or pod crash, restart, eviction, health-check failure, or origin withdrawal during abnormal HTTP/2 traffic.
· CDN-to-origin errors, WAF anomalies, gateway failures, ingress-controller errors, upstream retry expansion, service-mesh error propagation, or load-balancer target-health degradation aligned with HTTP/2 protocol anomalies.
· Downstream application degradation following HTTP/2 edge anomalies, including API latency increase, backend saturation, dependency timeouts, autoscaling surges, retry storms, or user-facing availability loss.
· Similar HTTP/2 header, continuation, reset, or cancellation patterns distributed across multiple edge nodes, regions, origins, tenants, routes, applications, or service tiers.
Supporting Detection Signals
Supporting signals should strengthen confidence, add context, and help distinguish malicious HTTP/2 resource-exhaustion behavior from normal browser behavior, mobile-network instability, high-volume customer usage, deployment activity, load testing, synthetic monitoring, vulnerability scanning, or resilience testing. These signals should not usually alert independently unless they affect highly sensitive application paths or appear with resource-exhaustion or availability-impact signals.
High-Value Supporting Signals
· Source activity from unfamiliar geographies, autonomous systems, hosting providers, proxy networks, VPN services, anonymization infrastructure, or client populations not normally associated with the affected application.
· Repeated HTTP/2 anomalies from the same source, source cluster, user agent, TLS fingerprint, client fingerprint, autonomous system, or geolocation.
· Rare or unusual user-agent strings, client fingerprints, TLS characteristics, request timing, connection reuse behavior, or stream lifecycle behavior associated with HTTP/2 anomalies.
· Abnormal request concentration against authentication routes, API routes, customer portals, payment paths, CDN origins, Kubernetes ingress paths, service-mesh ingress paths, or other business-critical application routes.
· Traffic patterns with high connection persistence, high stream churn, high reset frequency, low successful transaction rate, or low response-value ratio.
· Header-size or header-count distributions that deviate from normal application behavior for the affected route, client class, tenant, or service.
· Increased request rejection, malformed-request handling, protocol-error handling, or header-limit enforcement on HTTP/2-enabled entry points.
· Increased WAF, CDN, API-gateway, reverse-proxy, ingress-controller, or service-mesh rule activity involving HTTP/2 traffic handling, header enforcement, request rejection, or connection control.
· Edge-node or origin-node resource pressure across multiple systems receiving similar HTTP/2 traffic patterns.
· Change-control records showing no approved load test, deployment, failover, CDN change, WAF tuning, ingress update, service-mesh update, resilience test, or HTTP/2 configuration change during the event window.
· Security-control activation, including rate limits, stream limits, header limits, connection limits, WAF rules, CDN protections, gateway circuit breakers, origin shielding, autoscaling, or traffic shaping.
Exploit Attempt and Instability Signals
Exploit attempt and instability signals are useful when they appear near abnormal HTTP/2 protocol behavior, source concentration, resource pressure, or service degradation. These signals should not be treated as confirmed exploitation by themselves because web infrastructure commonly produces errors, resets, restarts, and resource spikes during traffic surges, deployments, failovers, load testing, and client-side network instability.
Relevant Exploit Attempt and Instability Signals
· Repeated HTTP/2 protocol errors, stream errors, frame errors, header-limit errors, frame-limit errors, malformed-header errors, or connection-reset events.
· Repeated 400, 413, 431, 499, 502, 503, 504, upstream timeout, gateway timeout, or origin error responses concentrated on HTTP/2-enabled paths.
· CONTINUATION-frame activity associated with incomplete header processing, delayed header completion, excessive buffering, abnormal memory growth, or parser stress.
· Rapid stream reset, request cancellation, or stream churn behavior associated with CPU pressure, worker pressure, queue expansion, or connection-table growth.
· Reverse-proxy, API-gateway, load-balancer, WAF, CDN, ingress-controller, service-mesh, or web-server warnings involving HTTP/2 parsing, stream handling, header enforcement, protocol handling, request rejection, or upstream failure.
· Process crashes, worker restarts, gateway restarts, container restarts, pod evictions, out-of-memory events, node pressure, origin withdrawal, or health-check failures during abnormal HTTP/2 activity.
· Autoscaling events, retry expansion, circuit-breaker activation, connection draining, load-balancer target-health changes, or origin shielding activation during the same operational window.
· Application performance events involving route latency, backend saturation, dependency timeout expansion, queue growth, or user-facing availability degradation after HTTP/2 edge anomalies.
Instability signals should be elevated only when they align with abnormal HTTP/2 protocol behavior, suspicious source patterns, affected sensitive routes, resource-exhaustion telemetry, availability impact, or absence of approved operational activity.
Outbound Communication Signals
Outbound communication signals are conditionally relevant because HTTP/2 header abuse and memory exhaustion are primarily inbound protocol-resource attacks. Outbound signals should be used to assess service degradation, origin interaction, backend retry behavior, cloud-control-plane response, and infrastructure recovery activity rather than to imply command-and-control behavior.
High-Value Outbound and Downstream Communication Signals
· CDN-to-origin, WAF-to-origin, load-balancer-to-origin, API-gateway-to-backend, ingress-to-service, or service-mesh-to-upstream traffic showing abnormal retry volume, timeout expansion, connection churn, or request amplification during HTTP/2 anomalies.
· Reverse-proxy, gateway, ingress-controller, or service-mesh communication to backend services with elevated 502, 503, 504, upstream timeout, reset, or connection-refused patterns.
· Backend service calls showing increased latency, retry storms, queue expansion, dependency timeouts, or downstream saturation following edge-tier HTTP/2 pressure.
· Cloud load-balancer, CDN, WAF, or autoscaling control-plane events showing target-health changes, origin withdrawal, autoscaling surge, traffic shifting, or protection activation during abnormal HTTP/2 traffic.
· Kubernetes or container-platform events showing pod restart, container eviction, node pressure, ingress-controller scaling, service restart, or workload rescheduling during the same operational window.
· Monitoring, alerting, or incident-response integrations triggering availability, latency, resource, or edge-health alerts tied to the affected service path.
· Defensive egress behavior such as telemetry export, log forwarding, health-check traffic, autoscaling activity, or mitigation-control activation that aligns with service stress but should not be misinterpreted as adversary-controlled outbound communication.
Outbound communication should be correlated with inbound HTTP/2 protocol behavior, edge-service resource state, backend availability, and operational context before escalation.
Persistence and Post-Exploitation Signals (Conditional)
Persistence and post-exploitation signals are conditional because HTTP/2 header abuse and memory exhaustion do not inherently produce durable access. These signals become relevant only if exploitation is followed by suspicious host-level activity, unauthorized configuration changes, web-service tampering, credential access, or control-plane activity.
Relevant Conditional Persistence and Post-Exploitation Signals
· Unauthorized configuration changes to web servers, reverse proxies, API gateways, WAF policies, load-balancer listeners, ingress-controller settings, service-mesh routes, CDN origin settings, or HTTP/2 handling parameters after abnormal HTTP/2 activity.
· Suspicious process execution, shell activity, script execution, file writes, service changes, scheduled tasks, startup modifications, or unauthorized tooling on web infrastructure affected by HTTP/2 instability.
· New or modified web server modules, proxy modules, gateway filters, WAF rules, ingress-controller plugins, service-mesh filters, or application middleware after suspicious HTTP/2 events.
· Unexpected changes to rate limits, header limits, stream limits, connection limits, timeout settings, circuit-breaker settings, or origin-routing behavior without approved change-control context.
· Credential access, environment-variable inspection, secret access, cloud credential use, Kubernetes credential use, service-account activity, or administrative login activity from affected web infrastructure.
· New accounts, service accounts, API keys, access tokens, cloud roles, Kubernetes role bindings, deployment permissions, or administrative sessions associated with affected infrastructure after the event.
· File-system artifacts, crash dumps, core files, temporary files, suspicious scripts, unexpected binaries, or modified application files created during or after abnormal HTTP/2 activity.
· Cloud, Kubernetes, container, or deployment-control-plane changes tied to infrastructure that experienced HTTP/2 instability.
These signals should not be assumed from protocol abuse alone. They should be evaluated only when host, identity, cloud, Kubernetes, application, or incident-response evidence indicates activity beyond denial-of-service or resource exhaustion.
Lateral Movement and Expansion Signals (Conditional)
Lateral movement and expansion signals are conditional because HTTP/2 header abuse and memory exhaustion usually affect availability and edge-tier stability rather than producing direct internal movement. These signals become higher confidence only if suspicious activity appears after HTTP/2 instability and can be linked to affected infrastructure, privileged identities, service accounts, or deployment paths.
Relevant Conditional Lateral Movement and Expansion Signals
· Authentication attempts, administrative access, or service-account use from web servers, reverse proxies, API gateways, ingress controllers, service-mesh gateways, or affected application infrastructure after abnormal HTTP/2 activity.
· Internal network access from affected web infrastructure to identity providers, secret stores, administrative interfaces, deployment systems, databases, Kubernetes APIs, cloud metadata services, or sensitive internal applications outside expected service scope.
· Cloud API activity, Kubernetes API activity, deployment-platform activity, container-registry access, infrastructure-as-code execution, or secret-manager access using identities associated with affected web infrastructure.
· Use of affected infrastructure to initiate unusual internal DNS queries, service discovery, credential validation, lateral authentication, remote execution attempts, or internal scanning.
· Expansion from edge infrastructure into backend application tiers, administrative systems, orchestration platforms, cloud services, or deployment automation systems after service instability.
· Access from affected systems to logs, crash dumps, memory dumps, configuration files, credentials, service tokens, application secrets, or deployment artifacts.
· Cross-region, cross-service, or cross-environment activity involving the same infrastructure identity, service account, workload identity, container identity, or cloud role after the event.
Expansion should not be attributed to HTTP/2 exploitation unless identity, timing, host, protocol, infrastructure, credential, or incident-response lineage supports the connection.
Signal Usage Constraints
Signals in this section should be used as correlation inputs, not as standalone proof of exploitation or compromise. HTTP/2-enabled web infrastructure commonly produces resets, malformed-request handling, protocol errors, queue growth, retries, autoscaling events, and intermittent gateway failures during legitimate traffic, client cancellations, deployments, failovers, load tests, monitoring activity, and security testing.
Signal Interpretation Constraints
· Do not treat a single oversized header, malformed request, stream reset, protocol error, 413 response, 431 response, proxy warning, memory spike, container restart, or gateway timeout as confirmed exploitation.
· Do not treat HTTP/2 stream resets or request cancellations as malicious without abnormal rate, source behavior, route targeting, protocol context, resource pressure, or service impact.
· Do not treat CONTINUATION-frame activity as malicious without evidence of abnormal volume, incomplete header behavior, resource pressure, request rejection, parser stress, or infrastructure instability.
· Do not treat memory growth, worker exhaustion, pod restart, autoscaling, or gateway failure as HTTP/2 abuse without protocol, source, route, timing, and infrastructure lineage.
· Do not attribute downstream application degradation to HTTP/2 abuse unless affected routes, listeners, gateways, origins, pods, services, or backends can be tied to abnormal HTTP/2 behavior.
· Do not interpret outbound or downstream communication as adversary command-and-control without host, process, destination, identity, and incident-response evidence.
· Do not infer persistence, lateral movement, or post-exploitation behavior from denial-of-service activity unless host, identity, cloud, Kubernetes, application, or incident-response telemetry supports that conclusion.
· Do not use IP addresses, autonomous systems, user agents, scanner names, proof-of-concept names, payload fragments, or CVE identifiers as the primary detection model.
· Do not enable high-severity alerting until HTTP/2 log fields, proxy fields, WAF fields, CDN fields, resource telemetry, timing windows, baselines, exceptions, field mappings, false-positive handling, and SOC triage procedures are validated.
· Treat confirmed multi-signal chains involving HTTP/2 protocol anomalies, abnormal source behavior, resource exhaustion, edge-service instability, and availability impact as the strongest detection path.
S23 — Telemetry Requirements
Endpoint and Process Execution Telemetry
Endpoint and process execution telemetry should prioritize systems that terminate, proxy, inspect, route, or support HTTP/2 traffic. The highest-value endpoint coverage is on internet-facing web servers, reverse proxies, API gateways, WAF nodes, load-balancer targets, Kubernetes ingress controllers, service-mesh ingress gateways, CDN origin servers, application front ends, and supporting container or cloud workloads.
Endpoint telemetry is not the primary source for identifying HTTP/2 protocol abuse, but it is essential for confirming resource impact, crash behavior, service restarts, operational response actions, and conditional post-exploitation activity.
Required Endpoint and Process Telemetry
· Process creation events from web servers, reverse proxies, API gateways, ingress controllers, service-mesh gateways, WAF nodes, application front ends, and origin servers.
· Process termination, restart, crash, reload, or recovery events from HTTP/2-enabled infrastructure.
· Parent-child process relationships showing web-service workers, gateway processes, controller processes, container entrypoints, supervisor processes, service managers, and recovery scripts.
· Command-line telemetry for service restarts, configuration reloads, diagnostic commands, crash-dump handling, log collection, mitigation scripts, and emergency operational changes.
· User, service account, workload identity, container identity, pod identity, host identity, and cloud role context where available.
· Process activity associated with web-service control utilities, reverse-proxy binaries, gateway binaries, ingress-controller processes, service-mesh proxies, WAF components, container runtimes, cloud CLIs, Kubernetes CLIs, and diagnostic tooling.
· Process activity occurring during or immediately after abnormal HTTP/2 traffic, memory pressure, worker exhaustion, gateway instability, service restart, pod eviction, or application degradation.
· Suspicious process execution, shell activity, script execution, unauthorized tooling, credential access, or administrative activity on affected infrastructure after HTTP/2 instability.
Endpoint telemetry must preserve process lineage. Detection and triage should be able to connect an affected service, process tree, container, pod, host, workload identity, restart event, resource condition, and operational action wherever local logging permits.
Memory and Execution Telemetry
Memory and execution telemetry is required because HTTP/2 header abuse and memory exhaustion frequently appear as excessive allocation, worker pressure, queue growth, process instability, container memory pressure, or out-of-memory behavior before a clean security alert appears. This telemetry helps distinguish protocol-resource abuse from normal traffic surges, deployment issues, backend failures, and infrastructure scaling events.
Required Memory and Execution Telemetry
· Host memory utilization for HTTP/2-enabled web servers, reverse proxies, API gateways, WAF nodes, ingress controllers, service-mesh gateways, load-balancer targets, CDN origins, and application front ends.
· Process-level memory utilization for web-service workers, reverse-proxy workers, gateway workers, ingress-controller processes, service-mesh proxy processes, application workers, and supporting runtime processes.
· Container memory utilization, memory limits, memory throttling, restart count, eviction events, and out-of-memory kill events for HTTP/2-enabled workloads.
· CPU utilization, worker utilization, thread-pool saturation, event-loop delay, queue depth, connection-table pressure, file-descriptor usage, request-backlog growth, and process scheduling pressure.
· Memory allocation trends that align with abnormal CONTINUATION-frame activity, incomplete header processing, excessive header buffering, high stream churn, request cancellation, or protocol-error spikes.
· Runtime telemetry showing web-service degradation, worker starvation, event-loop blocking, garbage-collection pressure, heap growth, buffer expansion, connection-handler pressure, or request-processing delays.
· EDR or workload telemetry showing suspicious execution after HTTP/2 instability, including shell activity, diagnostic script execution, unauthorized binaries, credential access, or abnormal administrative activity.
· Container runtime telemetry showing pod restart, container crash, image restart, sidecar instability, runtime errors, or workload rescheduling during abnormal HTTP/2 activity.
Memory and execution telemetry should support correlation, not replace protocol evidence. Resource pressure is strongest when tied back to HTTP/2 protocol anomalies, affected routes, source behavior, edge-service telemetry, and service-impact timing.
Crash and Fault Telemetry
Crash and fault telemetry should be collected from web servers, reverse proxies, API gateways, WAF nodes, CDNs, load balancers, ingress controllers, service-mesh components, application front ends, containers, Kubernetes nodes, and cloud hosting services. These signals help identify failed exploitation, resource-exhaustion impact, unstable protocol handling, protective-control activation, and recovery behavior.
Required Crash and Fault Telemetry
· Web-server, reverse-proxy, gateway, WAF, ingress-controller, service-mesh, application-server, and load-balancer error logs.
· HTTP/2 protocol errors, stream errors, frame errors, CONTINUATION-frame handling errors, header-limit errors, frame-limit errors, malformed-header errors, and connection-reset events.
· Repeated 400, 413, 431, 499, 502, 503, 504, upstream timeout, gateway timeout, origin error, target-health failure, or service-unavailable events.
· Process crashes, worker restarts, gateway restarts, service reloads, crash loops, container restarts, pod evictions, out-of-memory kills, node pressure events, and origin withdrawal events.
· Health-check failures, load-balancer target-health changes, CDN origin errors, WAF enforcement actions, gateway circuit-breaker activation, service-mesh retry expansion, or upstream failure propagation.
· Application performance faults involving route latency, backend saturation, dependency timeouts, queue growth, retry storms, autoscaling surges, and user-facing availability degradation.
· Cloud and Kubernetes fault events involving ingress-controller instability, pod restart count, memory-limit breach, container eviction, horizontal pod autoscaler activity, load-balancer target deregistration, and service rescheduling.
· Operational fault records showing mitigation activation, emergency configuration changes, traffic shaping, rate limiting, stream limiting, header limiting, connection limiting, or incident-response action.
Crash and fault telemetry should be interpreted conservatively. These events should increase detection confidence only when they align with abnormal HTTP/2 protocol behavior, source behavior, resource pressure, affected sensitive routes, or absence of approved operational activity.
File and Persistence Telemetry
File and persistence telemetry is conditionally required because HTTP/2 header abuse and memory exhaustion do not inherently create durable access. It becomes important when affected infrastructure shows suspicious configuration changes, unauthorized service changes, host-level activity, crash artifacts, credential access, or evidence that instability was followed by broader intrusion behavior.
Required File and Persistence Telemetry
· Creation, modification, or deletion of web-server, reverse-proxy, API-gateway, WAF, load-balancer, ingress-controller, service-mesh, CDN origin, and application configuration files.
· Changes to HTTP/2 handling parameters, header limits, stream limits, connection limits, timeout settings, rate limits, circuit-breaker settings, origin-routing behavior, upstream routing, or proxy buffering behavior.
· Creation or modification of crash dumps, core files, temporary files, diagnostic bundles, emergency logs, compressed logs, memory dumps, or service recovery artifacts during or after abnormal HTTP/2 activity.
· File activity involving web roots, application directories, reverse-proxy modules, gateway filters, WAF rules, ingress-controller plugins, service-mesh filters, middleware components, and startup or service-control paths.
· Unauthorized service creation, service modification, scheduled task creation, startup modification, shell-profile modification, unauthorized SSH key placement, suspicious script creation, or unexpected binary placement on affected infrastructure.
· Access to environment files, secret files, cloud credential files, Kubernetes configuration files, service-account tokens, API keys, TLS material, application secrets, deployment credentials, or administrative credential stores.
· Container file-system changes involving mounted secrets, projected service-account tokens, configuration maps, sidecar configuration, application files, proxy configuration, or runtime-generated artifacts.
· Cloud, Kubernetes, or deployment artifacts showing unauthorized role binding, service-account modification, workload identity change, deployment manifest change, image change, or infrastructure-as-code modification tied to affected infrastructure.
File telemetry should preserve path, user, process, service, container, pod, host, workload identity, timestamp, and change-control context. Detection value depends on linking file activity back to abnormal HTTP/2 behavior, service instability, or confirmed host-level evidence.
Network and Outbound Communication Telemetry
Network and outbound communication telemetry is required for identifying source behavior, connection patterns, distributed activity, backend retry behavior, CDN-to-origin pressure, gateway-to-service amplification, and infrastructure response. Because this report is centered on inbound protocol-resource abuse, outbound telemetry should be used primarily for service-impact correlation rather than default command-and-control assumptions.
Required Network and Outbound Communication Telemetry
· DNS, HTTP, TLS, proxy, firewall, load-balancer, CDN, WAF, NDR, cloud-flow, and service-mesh telemetry for HTTP/2-enabled infrastructure.
· Source IP, source autonomous system, source geolocation, source network type, user agent, TLS metadata, client fingerprint, request protocol, destination service, virtual host, route, listener, response code, request timing, byte count, and connection result where available.
· HTTP/2 connection counts, stream counts, stream reset counts, request cancellation rates, incomplete stream ratios, reset-to-completed-request ratios, connection reuse patterns, and request completion ratios.
· Network telemetry showing distributed source activity, concentrated route targeting, abnormal request patterns, connection persistence, high stream churn, request-to-response imbalance, or low successful transaction ratio.
· CDN-to-origin, WAF-to-origin, load-balancer-to-origin, API-gateway-to-backend, ingress-to-service, and service-mesh-to-upstream traffic showing retry expansion, timeout growth, connection churn, backend saturation, or request amplification.
· Internal network telemetry from affected web infrastructure to identity providers, secret stores, administrative interfaces, deployment systems, databases, Kubernetes APIs, cloud metadata services, or sensitive internal applications.
· Defensive egress telemetry for log forwarding, telemetry export, health checks, autoscaling behavior, mitigation-control activation, incident-response tooling, and monitoring integrations during the event window.
· Approved source baselines, partner integration records, synthetic monitoring records, vulnerability scanning records, load-testing records, CDN path inventories, WAF policy records, and known-good traffic profiles.
Network telemetry should be correlated with HTTP/2 protocol behavior, edge-service logs, resource telemetry, application telemetry, and operational context before being treated as high-confidence exploitation.
Web and Application Telemetry (Conditional Availability)
Web and application telemetry is required where available because it often provides the clearest view of HTTP/2 behavior, route impact, request rejection, upstream failure, application latency, and user-facing degradation. This telemetry is conditionally available because some HTTP/2 frame-level details may be visible only in specialized diagnostic logs, proxy debug logs, CDN datasets, WAF logs, packet metadata, or vendor-specific telemetry.
Relevant Web and Application Telemetry
· Web-server, reverse-proxy, API-gateway, WAF, CDN, load-balancer, ingress-controller, service-mesh, and application-front-end logs showing protocol version, method, host, route, listener, status, upstream result, response time, bytes, request rejection, and connection context.
· HTTP/2-specific telemetry showing HEADERS frames, CONTINUATION frames, RST_STREAM frames, stream lifecycle, header completion behavior, protocol errors, stream errors, frame errors, frame-size errors, and connection-level resets where available.
· Request rejection telemetry involving oversized headers, malformed headers, pseudo-header issues, header-count limits, header-size limits, frame limits, request-size limits, and protocol enforcement.
· Application telemetry showing route latency, transaction failures, API errors, backend saturation, dependency timeouts, queue expansion, retry behavior, and user-facing error rates.
· WAF and CDN telemetry showing rule activation, rate-limit activation, bot-control events, managed protection events, origin errors, cache-bypass behavior, traffic shaping, stream limiting, connection limiting, or header enforcement.
· API-gateway and service-mesh telemetry showing upstream retries, circuit-breaker activation, route-level error rates, service-to-service latency, connection-pool exhaustion, and upstream failure propagation.
· Kubernetes ingress and cloud load-balancer telemetry showing target-health changes, pod restarts, container evictions, scaling events, origin withdrawal, backend health degradation, and route-level traffic anomalies.
· Application logs showing affected tenant, route, customer path, API method, authentication path, business process, service dependency, and user-facing impact where available.
Web and application telemetry should be retained long enough to support retrospective investigation because HTTP/2 resource-exhaustion activity may be discovered through availability symptoms before protocol-level evidence is reviewed.
Telemetry Availability Requirements
Minimum viable detection requires telemetry from the HTTP/2-facing delivery layer, resource layer, application-impact layer, and operational context layer. The strongest detections require protocol-aware logs, source-behavior telemetry, infrastructure-resource telemetry, and application-availability telemetry correlated into a single timeline.
Required Availability Conditions
· HTTP/2-facing logs must identify protocol version, source, destination, host, route, listener, status code, response time, request result, upstream result, timestamp, and request rejection reason where available.
· HTTP/2 diagnostic telemetry should identify HEADERS activity, CONTINUATION-frame activity, RST_STREAM behavior, stream lifecycle, header completion behavior, protocol errors, frame errors, and connection resets where available.
· Edge-service telemetry must identify affected proxy, gateway, WAF, CDN, load balancer, ingress controller, service mesh, origin, worker, process, container, pod, host, and service where available.
· Resource telemetry must identify memory, CPU, worker utilization, thread-pool state, event-loop delay, queue depth, file descriptors, connection count, request backlog, process restart, container restart, and out-of-memory behavior where available.
· Application telemetry must identify route latency, backend saturation, dependency timeouts, application error rate, transaction failures, API degradation, user-facing error rate, and affected business service where available.
· Network telemetry must identify source IP, autonomous system, geolocation, client fingerprint, TLS metadata, connection counts, stream counts, reset counts, byte counts, timing, destination service, and distributed source patterns where available.
· Cloud, Kubernetes, and container telemetry must identify pod, namespace, service, node, workload identity, ingress resource, load-balancer target, scaling event, eviction event, resource limit, and container restart where available.
· Change-control and operational telemetry must identify approved load tests, performance tests, synthetic monitoring, vulnerability scans, deployments, failovers, CDN changes, WAF changes, ingress updates, service-mesh updates, and HTTP/2 configuration changes.
Telemetry must support time-based correlation across systems. Where timestamps, time zones, ingestion delays, sampling behavior, or clock synchronization are inconsistent, detection confidence should be reduced until timing can be normalized.
Telemetry Limitations and Gaps
Telemetry gaps can materially reduce confidence because HTTP/2 header abuse and memory exhaustion may be visible in one layer as protocol anomalies, in another as resource pressure, and in another as application degradation. Missing lineage can prevent analysts from proving whether HTTP/2 behavior caused the observed service impact.
Common Telemetry Limitations
· Web-server, reverse-proxy, WAF, CDN, API-gateway, load-balancer, ingress-controller, or service-mesh logs that do not expose HTTP/2 protocol version, frame-level behavior, stream lifecycle, header-limit events, request rejection reason, or upstream result.
· Environments where CONTINUATION-frame activity, RST_STREAM behavior, header completion state, HPACK processing behavior, or frame-size enforcement is visible only in debug logs or not retained.
· Resource telemetry that captures host-level pressure but does not identify affected process, worker, container, pod, service, route, or HTTP/2 listener.
· Network telemetry that captures connection volume but not protocol version, stream behavior, route context, user agent, client fingerprint, TLS metadata, request outcome, or backend impact.
· CDN, WAF, or load-balancer logs that mask origin source details, normalize client behavior, sample high-volume traffic, or obscure per-route request patterns.
· Kubernetes or container telemetry that lacks pod restart reason, memory-limit breach details, node pressure context, workload identity, ingress mapping, or service-to-route lineage.
· Application telemetry that shows latency or errors without identifying whether the affected route, tenant, method, API path, or business service was tied to HTTP/2 edge behavior.
· Change-control records that do not clearly identify load testing, performance testing, resilience testing, synthetic monitoring, vulnerability scanning, deployment, failover, CDN, WAF, ingress, or service-mesh changes.
· Short retention windows that prevent retrospective analysis after delayed discovery of HTTP/2 resource-exhaustion activity.
· Inconsistent naming across routes, virtual hosts, services, pods, containers, edge nodes, origins, load-balancer targets, CDN properties, WAF policies, and application services.
When telemetry gaps exist, detections should remain hunting-oriented or medium-confidence until sufficient lineage can be established. High-confidence alerting should require validated protocol, source, resource, edge-service, application, and operational-context correlation.

Figure 4
S24 — Detection Opportunities and Gaps
Detection Opportunities
HTTP/2 header abuse and memory exhaustion across web infrastructure creates strong detection opportunities because the activity can be observed across multiple layers: HTTP/2 protocol behavior, source behavior, edge-service instability, resource pressure, application degradation, cloud or Kubernetes response, and operational context. The highest-value opportunities occur where HTTP/2-specific anomalies can be correlated with memory growth, worker exhaustion, gateway instability, route-level degradation, or user-facing availability impact.
Detection should prioritize behavior that creates disproportionate server-side work compared with completed requests, successful application transactions, or normal client behavior. The model should avoid treating isolated HTTP errors, stream resets, malformed requests, memory spikes, or gateway failures as standalone proof of exploitation.
Primary Detection Opportunities
· Excessive HTTP/2 HEADERS or CONTINUATION-frame activity followed by memory growth, worker exhaustion, process restart, container restart, pod eviction, or gateway instability.
· CONTINUATION-frame sequences that delay, defer, or fail to complete header processing while affected infrastructure shows abnormal allocation, buffering, parser stress, or request rejection.
· Rapid HTTP/2 request cancellation, stream reset, or stream churn followed by CPU pressure, queue growth, connection-table pressure, event-loop delay, or service degradation.
· High reset-to-completed-request ratios, incomplete stream ratios, or request-cancellation rates concentrated on HTTP/2-enabled routes, listeners, origins, gateways, or ingress paths.
· Repeated 400, 413, 431, 499, 502, 503, 504, upstream timeout, protocol error, frame-limit, header-limit, or connection-reset events aligned with abnormal HTTP/2 behavior.
· Source clusters, autonomous systems, geographies, TLS fingerprints, user agents, or client fingerprints generating similar HTTP/2 anomaly patterns across multiple edge nodes, regions, origins, routes, tenants, or services.
· CDN-to-origin, WAF-to-origin, load-balancer-to-origin, API-gateway-to-backend, ingress-to-service, or service-mesh-to-upstream traffic showing retry expansion, timeout growth, connection churn, or request amplification during abnormal HTTP/2 traffic.
· Reverse-proxy, gateway, ingress-controller, service-mesh, WAF, CDN, load-balancer, application, or container telemetry showing resource pressure and service impact during the same operational window.
· Cloud, Kubernetes, or container events showing autoscaling surge, target-health change, pod restart, container eviction, node pressure, workload rescheduling, or service instability tied to HTTP/2-facing infrastructure.
· Absence of approved load testing, synthetic monitoring, vulnerability scanning, performance testing, failover, deployment, CDN change, WAF tuning, ingress update, service-mesh change, or HTTP/2 configuration change during the event window.
High-Value Correlation Opportunities
High-value correlation should focus on multi-signal chains rather than isolated protocol or availability events. The best opportunities show abnormal HTTP/2 behavior causing measurable resource pressure or service impact across the edge and application-delivery path.
Priority Correlation Chains
· CONTINUATION-frame anomaly followed by memory growth, worker exhaustion, request rejection, process restart, or container eviction on the same HTTP/2-enabled service path.
· Rapid stream reset or request cancellation behavior followed by CPU pressure, queue-depth increase, event-loop delay, gateway errors, or route-level latency increase.
· Concentrated HTTP/2 protocol errors followed by upstream timeout growth, gateway failures, origin health degradation, or load-balancer target-health changes.
· Distributed source activity producing similar header, continuation, reset, or cancellation patterns across multiple edge nodes, origins, regions, or application routes.
· HTTP/2 anomaly affecting an authentication path, API route, payment workflow, customer portal, SaaS front end, Kubernetes ingress path, service-mesh ingress path, or other business-critical service.
· HTTP/2 edge anomaly followed by backend retry storms, dependency timeouts, autoscaling surge, queue expansion, or application transaction failures.
· HTTP/2 protocol anomaly occurring during a period with no approved operational activity that would explain the observed resource pressure or service degradation.
· Repeated request rejection or protocol-error activity followed by WAF rules, CDN protections, rate limits, stream limits, header limits, connection limits, gateway circuit breakers, origin shielding, or traffic shaping.
· Edge-service crash, restart, eviction, or origin withdrawal aligned with abnormal HTTP/2 source behavior and route-specific service impact.
· Abnormal HTTP/2 behavior followed by conditional host, file, identity, cloud, Kubernetes, or deployment-control-plane activity requiring post-exploitation validation.
Detection Engineering Opportunities
Detection engineering should convert durable HTTP/2 resource-exhaustion behavior into platform-specific logic while preserving correlation discipline. The strongest engineering opportunities are those that can be expressed across multiple systems without depending on a single CVE identifier, proof-of-concept name, vendor event, user agent, source IP, route name, or one-off indicator.
Priority Engineering Opportunities
· Correlating CONTINUATION-frame activity, incomplete header behavior, header-limit enforcement, frame-limit enforcement, or protocol errors with memory growth and worker pressure.
· Correlating rapid stream resets, request cancellations, or high stream churn with CPU pressure, queue growth, event-loop delay, connection-table pressure, and gateway instability.
· Correlating repeated 400, 413, 431, 499, 502, 503, 504, upstream timeout, or target-health failures with abnormal HTTP/2 protocol behavior.
· Correlating source clusters, client fingerprints, autonomous systems, user agents, TLS metadata, and geographies with repeated HTTP/2 anomaly patterns.
· Correlating CDN, WAF, reverse-proxy, load-balancer, API-gateway, ingress-controller, service-mesh, and application logs into route-level and service-level timelines.
· Correlating resource telemetry from hosts, containers, pods, workers, gateways, and cloud workloads with HTTP/2 protocol and route telemetry.
· Correlating Kubernetes, cloud, autoscaling, target-health, container, and monitoring events with HTTP/2-facing infrastructure under stress.
· Correlating protective-control activation with HTTP/2 anomaly patterns and affected business-critical routes.
· Correlating change-control records with protocol, resource, and availability telemetry to suppress approved load tests, deployments, failovers, resilience tests, vulnerability scans, and synthetic monitoring.
· Building hunt-to-alert promotion logic that requires validated protocol, source, resource, service-impact, and operational-context evidence before high-severity alerting.
SOC Triage Opportunities
SOC triage should focus on proving or disproving lineage across source behavior, HTTP/2 protocol behavior, edge-service state, resource pressure, application impact, and operational context. This approach helps analysts avoid overreacting to normal web infrastructure noise while still escalating credible resource-exhaustion chains.
High-Value Triage Questions
· Which HTTP/2-enabled edge service, virtual host, listener, route, origin, ingress controller, API gateway, service mesh, WAF layer, CDN path, application, tenant, or business service was affected?
· What source infrastructure, autonomous systems, user agents, TLS fingerprints, client fingerprints, geographies, proxy paths, or source clusters generated the abnormal activity?
· Did the activity involve excessive CONTINUATION frames, incomplete header sequences, abnormal HEADERS activity, rapid stream resets, high stream churn, request cancellation, header-limit events, frame-limit events, or HTTP/2 protocol errors?
· Did the affected infrastructure show memory growth, CPU pressure, worker exhaustion, thread-pool saturation, file-descriptor pressure, queue growth, connection-table pressure, event-loop delay, process restart, pod restart, container eviction, or out-of-memory behavior?
· Did the event produce 400, 413, 431, 499, 502, 503, 504, upstream timeout, health-check failure, origin withdrawal, target-health degradation, autoscaling surge, retry expansion, or user-facing service degradation?
· Was the activity expected under approved load testing, resilience testing, performance testing, synthetic monitoring, vulnerability scanning, deployment, failover, CDN change, WAF tuning, ingress update, service-mesh update, or HTTP/2 configuration change?
· Did the affected route involve authentication, customer portals, APIs, payment workflows, SaaS front ends, cloud ingress, Kubernetes ingress, service-mesh ingress, or other business-critical paths?
· Is the same HTTP/2 behavior visible across multiple edge nodes, regions, origins, applications, tenants, routes, or service tiers?
· Did mitigation controls activate, including WAF rules, CDN protections, rate limits, connection limits, stream limits, header limits, gateway circuit breakers, autoscaling, origin shielding, or traffic shaping?
· Is there any conditional evidence of suspicious process execution, unauthorized configuration change, credential access, cloud activity, Kubernetes activity, or deployment-control-plane activity after the HTTP/2 event?
· Can the event be reconstructed from source behavior through HTTP/2 protocol anomalies, edge-service resource pressure, downstream availability impact, operational context, and response actions?
Detection Gaps
Detection gaps are most likely where HTTP/2 protocol behavior, edge-service logs, resource telemetry, application telemetry, network telemetry, cloud telemetry, Kubernetes telemetry, and operational context are collected separately or retained for different periods. HTTP/2 resource-exhaustion activity may appear first as availability degradation, memory pressure, gateway instability, or backend errors before analysts identify the protocol-layer cause.
Common Detection Gaps
· Web-server, reverse-proxy, WAF, CDN, API-gateway, load-balancer, ingress-controller, or service-mesh logs that do not expose HTTP/2 protocol version, frame-level behavior, stream lifecycle, header-limit events, request rejection reason, or upstream result.
· Environments where CONTINUATION-frame activity, RST_STREAM behavior, header completion state, HPACK processing behavior, or frame-size enforcement is visible only in debug logs or is not retained.
· Resource telemetry that shows host, container, pod, or node pressure without identifying the affected process, worker, service, route, listener, origin, or HTTP/2 connection context.
· Network telemetry that captures connection volume but does not preserve protocol version, stream behavior, route context, user agent, TLS metadata, client fingerprint, request outcome, or backend impact.
· CDN, WAF, load-balancer, or proxy layers that normalize traffic, obscure source detail, sample high-volume events, mask origin behavior, or prevent route-level correlation.
· Kubernetes or container telemetry that lacks pod restart reason, memory-limit breach details, node pressure context, workload identity, ingress mapping, service mapping, or route lineage.
· Application telemetry that shows latency, errors, or transaction failures without identifying whether the affected route, tenant, method, API path, or business service was tied to HTTP/2 edge behavior.
· Cloud telemetry that does not connect load-balancer health, WAF activity, CDN activity, autoscaling events, container events, monitoring alerts, and service-impact data into a common timeline.
· Change-control records that do not clearly identify load testing, performance testing, resilience testing, synthetic monitoring, vulnerability scanning, deployment, failover, CDN, WAF, ingress, service-mesh, or HTTP/2 configuration changes.
· Short retention windows that prevent retrospective analysis after delayed discovery of HTTP/2 resource-exhaustion activity.
Operational Gaps
Operational gaps can prevent technically available signals from becoming effective detections. These gaps often appear when security teams, platform teams, application owners, cloud teams, DevOps teams, and network teams do not share a common view of HTTP/2-facing infrastructure and service-impact lineage.
Common Operational Gaps
· No authoritative inventory of HTTP/2-enabled web servers, reverse proxies, API gateways, WAF nodes, load balancers, CDN origins, Kubernetes ingress controllers, service-mesh gateways, application front ends, and exposed routes.
· No clear mapping between internet-facing routes, virtual hosts, listeners, origins, backend services, Kubernetes services, cloud load-balancer targets, CDN properties, WAF policies, and business-critical applications.
· No approved baseline for HTTP/2 request volume, stream behavior, request cancellation, stream resets, header sizes, protocol errors, request rejection, resource usage, route latency, backend retries, and autoscaling behavior.
· Limited SOC access to CDN logs, WAF logs, reverse-proxy logs, API-gateway logs, ingress logs, service-mesh logs, load-balancer logs, container logs, Kubernetes events, cloud telemetry, application performance data, and change-control records.
· Limited ability to rapidly determine whether service degradation is caused by HTTP/2 protocol abuse, backend dependency failure, deployment regression, load testing, synthetic monitoring, vulnerability scanning, or legitimate traffic growth.
· Limited ability to apply or tune mitigations such as stream limits, header limits, rate limits, connection limits, gateway circuit breakers, WAF rules, CDN protections, origin shielding, autoscaling, or traffic shaping.
· Limited runbooks for HTTP/2 resource-exhaustion events, reverse-proxy instability, ingress-controller pressure, API-gateway degradation, CDN-to-origin overload, and backend retry storms.
· Limited collaboration between SOC, network, application, platform, DevOps, cloud, Kubernetes, and incident-response teams during suspected HTTP/2 resource-exhaustion activity.
· Limited ability to validate whether post-event configuration changes, service restarts, crash artifacts, credential access, or administrative activity were approved operational actions or suspicious follow-on behavior.
· Limited retention or inconsistent naming across routes, services, pods, containers, origins, edge nodes, CDN properties, WAF policies, load-balancer targets, and application services.
Residual Detection Risk
Residual detection risk remains even with strong telemetry because HTTP/2-enabled web infrastructure generates frequent legitimate resets, cancellations, retries, protocol errors, autoscaling events, load-balancer health changes, and gateway instability during normal operations. Attackers can blend protocol-resource abuse into traffic patterns that resemble browser behavior, mobile-network instability, load testing, synthetic monitoring, vulnerability scanning, or high-volume customer usage.
Residual Risk Conditions
· The attacker distributes HTTP/2 activity across many sources, regions, autonomous systems, client fingerprints, user agents, or edge nodes.
· The attacker uses low-and-slow header, continuation, reset, or cancellation patterns that stay below simple volume thresholds.
· The affected CDN, WAF, proxy, or load-balancer layer samples logs, normalizes source detail, or masks origin-level behavior.
· Frame-level telemetry is unavailable, disabled, sampled, or retained for too short a period.
· Resource telemetry shows memory or worker pressure without route, listener, origin, or protocol lineage.
· Application latency or error telemetry cannot be tied back to the affected HTTP/2 path.
· Approved load testing, resilience testing, vulnerability scanning, synthetic monitoring, or deployment activity overlaps with suspicious HTTP/2 behavior.
· Autoscaling, traffic shifting, origin shielding, or CDN mitigation reduces visible impact while obscuring the root protocol behavior.
· Detection relies on source IPs, user agents, proof-of-concept names, or CVE identifiers rather than behavior correlation.
· Post-event host, file, identity, cloud, or Kubernetes activity cannot be separated from approved incident response or operational recovery.
Residual risk should be reduced through stronger HTTP/2 protocol visibility, route-to-service lineage, resource-to-route correlation, change-control integration, longer retention, operational runbooks, and tested mitigation procedures.
Priority Gap Closure Actions
Priority gap closure should focus on improving protocol visibility, infrastructure lineage, telemetry retention, operational ownership, and response speed before enabling broad high-severity alerting. The goal is to make HTTP/2 resource-exhaustion activity observable from source behavior through protocol anomalies, resource pressure, edge instability, application impact, and response actions.
Priority Actions
· Establish an authoritative inventory of HTTP/2-enabled web servers, reverse proxies, API gateways, WAF nodes, load balancers, CDN origins, Kubernetes ingress controllers, service-mesh gateways, application front ends, exposed routes, listeners, origins, and business-critical service paths.
· Map routes, virtual hosts, listeners, origins, CDN properties, WAF policies, load-balancer targets, ingress resources, Kubernetes services, service-mesh routes, backend services, and application owners into a common lineage model.
· Enable and retain HTTP/2-aware web, proxy, WAF, CDN, load-balancer, API-gateway, ingress, service-mesh, application, resource, cloud, Kubernetes, container, and network telemetry long enough for retrospective investigation.
· Capture HTTP/2 protocol version, request result, stream reset behavior, request cancellation, header-limit events, frame-limit events, protocol errors, route, listener, upstream result, response time, and source context wherever available.
· Baseline normal HTTP/2 request volume, stream behavior, reset rate, cancellation rate, header-size distribution, request rejection, resource usage, route latency, backend retry behavior, autoscaling activity, and gateway stability.
· Integrate change-control records for load testing, performance testing, resilience testing, synthetic monitoring, vulnerability scanning, deployments, failovers, CDN changes, WAF changes, ingress changes, service-mesh changes, and HTTP/2 configuration changes.
· Build correlation logic that joins HTTP/2 protocol anomalies, source behavior, edge-service logs, resource telemetry, application telemetry, cloud telemetry, Kubernetes telemetry, and operational context.
· Define hunt-to-alert promotion criteria requiring protocol anomaly, suspicious source behavior, resource pressure, service impact, and absence of approved operational activity before high-severity alerting.
· Build response procedures for stream limits, header limits, rate limits, connection limits, WAF rules, CDN protections, gateway circuit breakers, origin shielding, autoscaling controls, traffic shaping, and temporary HTTP/2 exposure reduction where operationally acceptable.
· Validate detection logic in hunt mode before alert promotion.
· Require multi-signal correlation before high-severity alerting.
S25 Ultra-Tuned Detection Engineering Rules
NDR / Network Behavioral Analytics
Detection Viability Assessment
NDR / Network Behavioral Analytics has three rules for this EXP report.
· NDR / Network Behavioral Analytics is viable for detecting network-visible behavior associated with HTTP/2 header abuse and memory exhaustion across web infrastructure, including source clustering, connection behavior, request-to-response imbalance, stream-reset patterns where protocol metadata is available, CDN-to-origin pressure, gateway-to-backend retry expansion, route targeting, and service-impact timing.
· NDR / Network Behavioral Analytics is strongest where network-flow telemetry, DNS telemetry, TLS metadata, HTTP metadata, proxy logs, CDN logs, WAF logs, load-balancer logs, API-gateway telemetry, ingress telemetry, service-mesh telemetry, origin inventory, route inventory, application criticality context, change-control records, and SIEM correlation can be combined.
· NDR / Network Behavioral Analytics can identify suspicious HTTP/2-facing traffic patterns even when frame-level telemetry is incomplete, provided the detection logic correlates source behavior, connection patterns, protocol indicators, backend pressure, route impact, resource-impact telemetry, and application-impact telemetry.
· NDR / Network Behavioral Analytics is not a standalone source for confirming HTTP/2 CONTINUATION-frame exploitation, Rapid Reset-style exploitation, memory exhaustion, application compromise, host compromise, persistence, lateral movement, or actor attribution because network telemetry may not fully observe frame completion state, HPACK behavior, service memory allocation, process state, application transaction context, or endpoint activity.
· NDR / Network Behavioral Analytics detections must be correlated with reverse-proxy logs, WAF logs, CDN logs, API-gateway logs, load-balancer logs, ingress-controller logs, service-mesh logs, application telemetry, resource telemetry, Kubernetes telemetry, cloud telemetry, change-control records, and incident-response evidence before classifying activity as probable exploitation.
· NDR / Network Behavioral Analytics detection content should be treated as high-value behavioral coverage for source clustering, edge-service pressure, origin retry expansion, route targeting, traffic imbalance, and service-impact scoping, not direct proof of exploit success.
· NDR / Network Behavioral Analytics rules should not generate high-confidence alerting from traffic volume alone, source novelty alone, HTTP error volume alone, stream reset behavior alone, connection churn alone, backend retry expansion alone, or route degradation alone without supporting protocol, source, resource, service-impact, or operational-context evidence.
Rule
HTTP/2 Edge-Facing Source Cluster and Stream-Behavior Anomaly
Rule Format
NDR behavioral HTTP/2 edge-source and stream-behavior correlation rule suitable for network-flow telemetry, TLS metadata, HTTP metadata, DNS telemetry, proxy logs, CDN logs, WAF logs, load-balancer logs, API-gateway logs, edge-service inventory, HTTP/2-enabled route inventory, client fingerprint enrichment, source reputation enrichment, application criticality enrichment, change-control records, and SIEM correlation after protocol-field validation, source-baseline validation, route mapping, timing-window tuning, and environment-specific allowlisting.
Detection Purpose
· Detect abnormal source clusters generating HTTP/2 traffic patterns consistent with header abuse, stream-reset abuse, request cancellation abuse, or resource-exhaustion attempts against exposed web infrastructure.
· Identify source behavior that creates disproportionate server-side work relative to completed requests, successful application transactions, or normal client behavior.
· Prioritize HTTP/2 anomalies affecting internet-facing web servers, reverse proxies, API gateways, WAF-protected applications, load balancers, CDN origins, Kubernetes ingress controllers, service-mesh ingress gateways, and business-critical routes.
· Support escalation when source clustering, stream churn, reset behavior, request cancellation, or HTTP/2 protocol anomalies align with edge-service resource pressure, gateway errors, route degradation, or application-impact telemetry.
· Preserve separation between suspicious HTTP/2 source behavior and confirmed exploitation by requiring supporting protocol, resource, service-impact, edge-service, change-control, or incident-response evidence before classifying activity as probable exploitation.
· This rule does not prove HTTP/2 exploitation, memory exhaustion, application compromise, host compromise, persistence, lateral movement, or actor attribution without supporting telemetry.
Detection Logic
· Identify inbound traffic to known HTTP/2-enabled edge services, including reverse proxies, web servers, API gateways, WAF-protected applications, load balancers, CDN origins, Kubernetes ingress controllers, service-mesh ingress gateways, and exposed application front ends.
· Prioritize source clusters, autonomous systems, geographies, hosting providers, user agents, TLS fingerprints, client fingerprints, or proxy paths producing repeated HTTP/2 anomalies during a short operational window.
· Prioritize traffic patterns involving abnormal connection persistence, high stream churn, high request cancellation, high stream-reset behavior, low completed-request ratio, low successful-transaction ratio, or request-to-response imbalance.
· Prioritize HTTP/2 protocol indicators where available, including HEADERS anomalies, CONTINUATION-frame anomalies, RST_STREAM behavior, incomplete stream ratios, stream lifecycle irregularity, protocol errors, frame-limit events, header-limit events, or request rejection.
· Increase confidence when the activity affects authentication paths, API routes, customer portals, payment paths, SaaS front ends, CDN origins, Kubernetes ingress paths, service-mesh ingress paths, or other business-critical services.
· Increase confidence when the same pattern appears across multiple edge nodes, origins, routes, regions, tenants, applications, or service tiers.
· Increase confidence when reverse-proxy, WAF, CDN, API-gateway, load-balancer, ingress, service-mesh, application, resource, or cloud telemetry shows memory pressure, worker pressure, event-loop delay, gateway errors, backend latency, target-health change, autoscaling surge, or service degradation.
· Reduce severity when activity matches approved load testing, performance testing, resilience testing, synthetic monitoring, vulnerability scanning, partner integrations, approved security testing, expected mobile-client behavior, known browser behavior, approved deployment windows, or approved incident-response activity.
· Do not classify HTTP/2 source clustering, stream resets, request cancellation, traffic volume, or source novelty as probable exploitation without supporting resource, service-impact, protocol, operational, or incident-response evidence.
· Do not use source IP, autonomous system, user agent, scanner name, proof-of-concept name, or CVE identifier as the primary detection basis.
Required Telemetry
· Network-flow telemetry.
· DNS telemetry.
· TLS metadata.
· HTTP metadata where available.
· HTTP protocol version.
· Source IP.
· Source autonomous system.
· Source geolocation.
· Source network type.
· User agent where available.
· TLS fingerprint where available.
· Client fingerprint where available.
· Destination service.
· Edge node.
· Virtual host.
· Route.
· Listener.
· Origin.
· Application service.
· Request count.
· Connection count.
· Stream count where available.
· Stream reset count where available.
· Request cancellation count where available.
· Completed request count where available.
· Response code.
· Request timing.
· Response timing.
· Byte count.
· Connection result.
· Request rejection reason where available.
· Header-limit event where available.
· Frame-limit event where available.
· Protocol-error event where available.
· CDN logs where available.
· WAF logs where available.
· Proxy logs where available.
· Load-balancer logs where available.
· API-gateway logs where available.
· Ingress-controller logs where available.
· Service-mesh logs where available.
· HTTP/2-enabled service inventory.
· Route and listener inventory.
· Business-critical route inventory.
· Approved source baseline.
· Approved partner integration records.
· Approved synthetic monitoring records.
· Approved vulnerability scanning records.
· Approved load-testing records.
· Approved security-testing records.
· Change-control records.
· Resource telemetry where available.
· Application performance telemetry where available.
· Incident-response records.
Engineering Implementation Instructions
· Build asset groups covering HTTP/2-enabled web servers, reverse proxies, API gateways, WAF-protected applications, load balancers, CDN origins, Kubernetes ingress controllers, service-mesh ingress gateways, and exposed application front ends.
· Build route groups covering authentication paths, API routes, customer portals, payment workflows, SaaS front ends, cloud ingress paths, Kubernetes ingress paths, service-mesh ingress paths, and other business-critical services.
· Build source-behavior groups covering repeated source clusters, rare autonomous systems, unusual geographies, hosting providers, proxy networks, VPN infrastructure, anonymization infrastructure, unfamiliar user agents, unusual TLS fingerprints, and abnormal client fingerprints.
· Build HTTP/2 behavior groups covering high connection persistence, high stream churn, high reset-to-completed-request ratio, high request-cancellation ratio, low transaction-success ratio, protocol errors, header-limit events, frame-limit events, and request rejection patterns.
· Build confidence-enrichment groups for memory pressure, worker pressure, event-loop delay, gateway errors, backend latency, target-health degradation, autoscaling surge, application errors, and user-facing availability impact.
· Validate whether NDR, TLS, HTTP, DNS, CDN, WAF, proxy, load-balancer, API-gateway, ingress, service-mesh, resource, application, and SIEM telemetry can reliably join on source, edge node, route, listener, origin, protocol version, timestamp, response code, and service context.
· Use short correlation windows for high-rate source behavior affecting sensitive routes.
· Use moderate correlation windows for lower-rate HTTP/2 behavior when the pattern aligns with resource pressure, route degradation, gateway errors, or application impact.
· Use longer correlation windows only when repeated source behavior, incident-response evidence, application-impact evidence, or retained protocol telemetry supports delayed linkage.
· Add severity weighting for business-critical routes, distributed source behavior, repeated protocol anomalies, low completion ratio, repeated request cancellation, stream reset concentration, resource pressure, and service degradation.
· Build allowlists for approved load testing, resilience testing, performance testing, synthetic monitoring, vulnerability scanning, partner integrations, known browser behavior, known mobile-client behavior, approved deployment windows, approved security testing, and approved incident-response activity.
· Treat abnormal HTTP/2 source behavior as a confidence amplifier, not standalone proof of exploitation.
· Validate all source groups, route groups, HTTP/2 behavior fields, timing windows, enrichment fields, exception logic, parser behavior, join logic, and local schema mappings before production deployment.
· Do not enable alert mode until HTTP/2 protocol fields, source baselines, route mapping, false-positive rate, query performance, enrichment availability, exception handling, change-control integration, and SOC triage workflow are validated.
DRI Assessment
DRI
8.2 / 10
· The rule is behaviorally anchored to durable HTTP/2 source clustering, stream behavior, request cancellation, reset behavior, and request-to-response imbalance rather than static IPs, user agents, proof-of-concept names, CVE identifiers, or one-off indicators.
· The rule remains useful if an adversary changes source infrastructure, user agent, route targeting, traffic timing, request shape, source distribution, or client fingerprint.
· The score is supported by the durability of abnormal source behavior and stream-lifecycle imbalance against HTTP/2-facing infrastructure.
· The score is constrained by incomplete HTTP/2 metadata, CDN or WAF normalization, source masking, encrypted traffic, sampled logs, legitimate client cancellation behavior, and approved testing activity.
· The rule is durable as an edge-source and traffic-behavior detector but should not be treated as standalone proof of HTTP/2 exploitation or memory exhaustion.
TCR Assessment
Operational TCR
7.5 / 10
Full-Telemetry TCR
8.7 / 10
· Operational confidence depends on HTTP/2 protocol visibility, source baselines, route mapping, edge-service inventory, client fingerprint enrichment, response-code visibility, and SIEM correlation quality.
· Operational confidence is reduced where CDN, WAF, proxy, or load-balancer layers mask source detail, normalize traffic, sample logs, or omit stream behavior.
· Operational confidence is reduced during load testing, synthetic monitoring, vulnerability scanning, failover activity, deployment windows, mobile-client instability, security testing, or traffic surges.
· Full-telemetry confidence improves when NDR data is enriched with CDN logs, WAF logs, proxy logs, API-gateway logs, ingress logs, service-mesh logs, resource telemetry, application telemetry, cloud telemetry, Kubernetes telemetry, and change-control records.
· Even under full telemetry conditions, this rule should support escalation and triage rather than standalone confirmation of exploit success.
Limitations
· NDR may not observe full HTTP/2 frame-level behavior unless protocol-aware metadata or packet-derived telemetry is available.
· CDN, WAF, proxy, and load-balancer layers may obscure source details, route context, or origin impact.
· Normal browser behavior, mobile-client cancellation, synthetic monitoring, vulnerability scanning, security testing, and load testing can create similar stream or reset patterns.
· The rule may miss low-and-slow activity that stays below source-cluster or reset-ratio thresholds.
· The rule may miss activity that is fully absorbed by CDN or WAF controls before reaching observable infrastructure.
· The rule cannot independently confirm memory exhaustion without resource or application telemetry.
· The rule should not be used for actor attribution without incident-specific intelligence, validated behavioral correlation, or confirmed victim-environment evidence.
Detection Query Pattern
NDR HTTP/2 edge-source anomaly query pattern requiring platform syntax validation, HTTP/2 field validation, source-baseline validation, route mapping, business-critical route enrichment, timing-window tuning, approved testing allowlisting, and environment-specific false-positive testing before production deployment.
NetworkEvent AS HTTP2EdgeSourceBehavior
WHERE HTTP2EdgeSourceBehavior.DestinationAsset IN ASSET_GROUP (
"HTTP/2 Web Servers",
"Reverse Proxies",
"API Gateways",
"WAF Protected Applications",
"Load Balancer Targets",
"CDN Origins",
"Kubernetes Ingress Controllers",
"Service Mesh Ingress Gateways",
"Application Front Ends"
)
AND HTTP2EdgeSourceBehavior.ProtocolVersion IN ANY (
"HTTP/2",
"h2",
"h2c"
)
AND (
HTTP2EdgeSourceBehavior.SourceContext IN ANY (
"repeated_source_cluster",
"rare_autonomous_system",
"unusual_geography",
"hosting_provider_source",
"proxy_network_source",
"vpn_source",
"anonymization_source",
"unusual_tls_fingerprint",
"unusual_client_fingerprint"
)
OR HTTP2EdgeSourceBehavior.BehaviorPattern IN ANY (
"high_stream_churn",
"high_stream_reset_ratio",
"high_request_cancellation_ratio",
"low_completed_request_ratio",
"low_successful_transaction_ratio",
"high_connection_persistence",
"request_response_imbalance",
"repeated_protocol_errors",
"repeated_header_limit_events",
"repeated_frame_limit_events"
)
)
AND OPTIONAL_CONFIDENCE_INCREASE WITHIN ENV_HTTP2_IMPACT_WINDOW (
ServiceImpactEvent AS RelatedServiceImpact
WHERE RelatedServiceImpact.AffectedRoute IN SAME_ROUTE(HTTP2EdgeSourceBehavior.Route)
AND RelatedServiceImpact.EventPattern IN ANY (
"memory_pressure",
"worker_pressure",
"event_loop_delay",
"gateway_error_increase",
"backend_latency_increase",
"target_health_degradation",
"autoscaling_surge",
"application_error_increase",
"user_facing_availability_loss"
)
)
AND OPTIONAL_CONFIDENCE_INCREASE WITHIN ENV_BUSINESS_ROUTE_WINDOW (
RouteContext AS SensitiveRouteContext
WHERE SensitiveRouteContext.Route IN SAME_ROUTE(HTTP2EdgeSourceBehavior.Route)
AND SensitiveRouteContext.RouteSensitivity IN ANY (
"authentication",
"api",
"customer_portal",
"payment",
"saas_front_end",
"cloud_ingress",
"kubernetes_ingress",
"service_mesh_ingress",
"business_critical"
)
)
AND NOT ChangeContext IN ANY (
"approved_load_testing",
"approved_performance_testing",
"approved_resilience_testing",
"approved_synthetic_monitoring",
"approved_vulnerability_scanning",
"approved_partner_integration",
"approved_deployment",
"approved_failover",
"approved_security_testing",
"approved_incident_response"
)
Rule
HTTP/2 Edge-to-Origin Retry Expansion and Service-Impact Correlation
Rule Format
NDR behavioral edge-to-origin and backend-pressure correlation rule suitable for network-flow telemetry, HTTP metadata, TLS metadata, CDN logs, WAF logs, load-balancer logs, API-gateway logs, reverse-proxy logs, ingress telemetry, service-mesh telemetry, origin inventory, backend-service inventory, application performance telemetry, resource telemetry, cloud telemetry, Kubernetes telemetry, change-control records, and SIEM correlation after origin mapping, route-to-service lineage validation, retry-baseline validation, timing-window tuning, and environment-specific allowlisting.
Detection Purpose
· Detect abnormal edge-to-origin, gateway-to-backend, ingress-to-service, or service-mesh-to-upstream communication patterns that indicate HTTP/2 resource-exhaustion pressure is propagating from the edge into application infrastructure.
· Identify retry expansion, timeout growth, backend saturation, connection churn, request amplification, target-health degradation, or origin withdrawal following abnormal HTTP/2 activity.
· Prioritize activity affecting business-critical routes, authentication paths, API services, payment workflows, customer portals, SaaS front ends, Kubernetes ingress paths, service-mesh ingress paths, and CDN origins.
· Support escalation when edge-to-origin pressure aligns with HTTP/2 protocol anomalies, source clustering, stream reset behavior, request cancellation, memory pressure, worker exhaustion, autoscaling events, or application degradation.
· Preserve separation between service-impact correlation and confirmed exploitation by requiring supporting protocol, source, resource, route, change-control, or incident-response evidence before classifying activity as probable HTTP/2 exploitation.
· This rule does not prove HTTP/2 exploitation, memory exhaustion, backend compromise, application compromise, cloud compromise, or actor attribution without supporting telemetry.
Detection Logic
· Identify communication from CDN, WAF, reverse-proxy, load-balancer, API-gateway, ingress-controller, or service-mesh layers to origin or backend services.
· Prioritize retry expansion, timeout growth, connection churn, connection refusal, upstream reset, backend saturation, request amplification, origin withdrawal, or load-balancer target-health degradation.
· Prioritize edge-to-origin pressure that occurs during or shortly after abnormal HTTP/2 source behavior, HTTP/2 protocol errors, stream reset behavior, request cancellation, header-limit events, frame-limit events, or request rejection patterns.
· Increase confidence when backend pressure affects business-critical routes, authentication paths, API routes, payment workflows, customer portals, SaaS front ends, Kubernetes ingress paths, service-mesh ingress paths, or sensitive application services.
· Increase confidence when resource telemetry shows memory growth, CPU pressure, worker exhaustion, queue growth, event-loop delay, pod restart, container eviction, node pressure, autoscaling surge, or application degradation.
· Increase confidence when the same edge-to-origin pressure appears across multiple edge nodes, origins, regions, backend services, service tiers, routes, or tenants.
· Reduce severity when activity matches approved load testing, failover, deployment, resilience testing, synthetic monitoring, vulnerability scanning, backend maintenance, CDN change, WAF change, ingress change, service-mesh change, security testing, or incident-response activity.
· Do not classify backend retry expansion, gateway timeouts, origin withdrawal, or target-health degradation as HTTP/2 exploitation without supporting HTTP/2 protocol, source, route, resource, or operational-context evidence.
· Do not interpret defensive telemetry export, health-check traffic, autoscaling activity, or mitigation-control activation as adversary-controlled outbound communication without host, process, identity, destination, and incident-response evidence.
Required Telemetry
· Network-flow telemetry.
· HTTP metadata where available.
· TLS metadata.
· Proxy logs where available.
· CDN logs where available.
· WAF logs where available.
· Load-balancer logs.
· API-gateway logs where available.
· Reverse-proxy logs where available.
· Ingress-controller logs where available.
· Service-mesh telemetry where available.
· Source edge node.
· Origin.
· Backend service.
· Destination service.
· Route.
· Listener.
· Virtual host.
· Response code.
· Upstream result.
· Connection result.
· Retry count where available.
· Timeout count where available.
· Connection reset count where available.
· Connection churn metrics where available.
· Target-health status where available.
· Origin health status where available.
· Request count.
· Byte count.
· Request timing.
· Response timing.
· Backend latency.
· Application latency.
· Application error rate.
· Resource telemetry where available.
· Cloud load-balancer telemetry where available.
· Kubernetes telemetry where available.
· Container telemetry where available.
· Autoscaling telemetry where available.
· Business-critical route inventory.
· Route-to-service mapping.
· Origin inventory.
· Backend-service inventory.
· Approved change-control records.
· Approved testing records.
· Incident-response records.
Engineering Implementation Instructions
· Build edge asset groups covering CDN edges, WAF layers, reverse proxies, load balancers, API gateways, ingress controllers, service-mesh ingress gateways, and exposed HTTP/2 application front ends.
· Build origin and backend groups covering CDN origins, load-balancer targets, backend services, Kubernetes services, service-mesh upstreams, application services, and business-critical application dependencies.
· Build route-to-service lineage mapping that connects virtual hosts, routes, listeners, origins, backend services, Kubernetes services, tenants, and business applications.
· Build pressure-pattern groups covering retry expansion, timeout growth, connection churn, upstream reset, connection refusal, backend saturation, request amplification, origin withdrawal, target-health degradation, and service-impact propagation.
· Build HTTP/2 anomaly enrichment groups covering source clustering, request cancellation, stream reset behavior, protocol errors, header-limit events, frame-limit events, request rejection, and low completed-request ratio.
· Build resource-impact enrichment groups covering memory pressure, CPU pressure, worker exhaustion, event-loop delay, queue growth, pod restart, container eviction, node pressure, autoscaling surge, backend latency, and application error increase.
· Validate whether NDR, CDN, WAF, proxy, load-balancer, API-gateway, ingress, service-mesh, resource, cloud, Kubernetes, application, and SIEM telemetry can reliably join on edge node, origin, backend service, route, listener, timestamp, protocol version, and response state.
· Use short correlation windows when edge-to-origin pressure occurs during active HTTP/2 anomaly windows.
· Use moderate correlation windows when retry expansion or target-health degradation follows lower-rate HTTP/2 anomalies.
· Use longer correlation windows only when route-to-service lineage, application-impact evidence, retained protocol telemetry, or incident-response evidence supports delayed linkage.
· Add severity weighting for business-critical route impact, repeated retry expansion, target-health degradation, origin withdrawal, backend latency, autoscaling surge, resource pressure, and absence of approved operational activity.
· Build allowlists for approved load testing, performance testing, failover, deployment, resilience testing, synthetic monitoring, vulnerability scanning, backend maintenance, CDN change, WAF change, ingress change, service-mesh change, security testing, and incident response.
· Treat edge-to-origin retry expansion as a service-impact amplifier, not standalone proof of HTTP/2 exploitation.
· Validate all edge groups, origin groups, route-to-service mappings, retry baselines, response-state fields, timing windows, enrichment fields, exception logic, parser behavior, join logic, and local schema mappings before production deployment.
· Do not enable alert mode until route-to-service lineage, retry baselines, target-health visibility, backend service mapping, false-positive rate, query performance, enrichment availability, exception handling, change-control integration, and SOC triage workflow are validated.
DRI Assessment
DRI
8.0 / 10
· The rule is behaviorally anchored to durable service-impact propagation from HTTP/2-facing edge infrastructure to origins and backend services rather than static indicators, CVE identifiers, source IPs, user agents, or proof-of-concept names.
· The rule remains useful if an adversary changes source infrastructure, request timing, route selection, user agent, HTTP/2 behavior mix, or attack distribution.
· The score is supported by the durability of edge-to-origin retry expansion, timeout growth, target-health degradation, origin withdrawal, backend saturation, and route-level service impact.
· The score is constrained by CDN abstraction, WAF normalization, weak route-to-service lineage, backend dependency noise, load testing, failover activity, application-level retry behavior, and approved security testing.
· The rule is durable as a service-impact correlation detector but should not be treated as standalone proof of HTTP/2 exploitation.
TCR Assessment
Operational TCR
7.3 / 10
Full-Telemetry TCR
8.6 / 10
· Operational confidence depends on reliable route-to-service mapping, edge-to-origin visibility, retry telemetry, target-health telemetry, origin inventory, backend-service inventory, application telemetry, and SIEM correlation quality.
· Operational confidence is reduced where CDN, WAF, load-balancer, or service-mesh telemetry is sampled, incomplete, or disconnected from backend service context.
· Operational confidence is reduced during failovers, deployments, traffic shifting, autoscaling events, resilience testing, load testing, synthetic monitoring, vulnerability scanning, backend maintenance, security testing, or incident response.
· Full-telemetry confidence improves when edge-to-origin network telemetry is enriched with HTTP/2 protocol telemetry, CDN logs, WAF logs, load-balancer logs, ingress logs, service-mesh telemetry, resource telemetry, Kubernetes events, cloud telemetry, application performance telemetry, and change-control records.
· Even under full telemetry conditions, this rule should support service-impact escalation and scoping rather than standalone confirmation of exploitation.
Limitations
· Edge-to-origin retry expansion can be caused by backend dependency failures, deployment regressions, autoscaling delays, failovers, security testing, or normal traffic surges.
· CDN, WAF, load-balancer, and service-mesh layers may obscure the original source or normalize route-level behavior.
· Weak route-to-service mapping can reduce confidence in linking edge anomalies to backend impact.
· NDR may not observe HTTP/2 frame-level behavior at encrypted or proxied layers.
· The rule may miss attacks fully absorbed by CDN or WAF controls before backend impact occurs.
· The rule may miss low-and-slow activity that degrades service without triggering retry or target-health thresholds.
· The rule should not be used for actor attribution without incident-specific intelligence, validated behavioral correlation, or confirmed victim-environment evidence.
Detection Query Pattern
NDR HTTP/2 edge-to-origin retry expansion query pattern requiring platform syntax validation, edge asset validation, origin mapping, route-to-service lineage validation, retry-baseline validation, HTTP/2 anomaly enrichment validation, timing-window tuning, approved operational allowlisting, and environment-specific false-positive testing before production deployment.
NetworkEvent AS HTTP2EdgeOriginPressure
WHERE HTTP2EdgeOriginPressure.SourceAsset IN ASSET_GROUP (
"CDN Edges",
"WAF Layers",
"Reverse Proxies",
"Load Balancers",
"API Gateways",
"Kubernetes Ingress Controllers",
"Service Mesh Ingress Gateways",
"HTTP/2 Application Front Ends"
)
AND HTTP2EdgeOriginPressure.DestinationAsset IN ASSET_GROUP (
"CDN Origins",
"Load Balancer Targets",
"Backend Services",
"Kubernetes Services",
"Service Mesh Upstreams",
"Application Services",
"Business Critical Application Dependencies"
)
AND (
HTTP2EdgeOriginPressure.ServiceImpactPattern IN ANY (
"retry_expansion",
"timeout_growth",
"connection_churn",
"upstream_reset_increase",
"connection_refusal_increase",
"backend_saturation",
"request_amplification",
"origin_withdrawal",
"target_health_degradation",
"backend_latency_increase"
)
OR HTTP2EdgeOriginPressure.ResponsePattern IN ANY (
"elevated_502",
"elevated_503",
"elevated_504",
"upstream_timeout_increase",
"gateway_timeout_increase",
"origin_error_increase",
"target_unhealthy"
)
)
AND OPTIONAL_CONFIDENCE_INCREASE WITHIN ENV_HTTP2_ANOMALY_WINDOW (
NetworkEvent AS RelatedHTTP2Anomaly
WHERE RelatedHTTP2Anomaly.Route IN SAME_ROUTE(HTTP2EdgeOriginPressure.Route)
AND RelatedHTTP2Anomaly.ProtocolVersion IN ANY (
"HTTP/2",
"h2",
"h2c"
)
AND RelatedHTTP2Anomaly.BehaviorPattern IN ANY (
"source_cluster_anomaly",
"high_stream_churn",
"high_stream_reset_ratio",
"high_request_cancellation_ratio",
"low_completed_request_ratio",
"repeated_protocol_errors",
"repeated_header_limit_events",
"repeated_frame_limit_events",
"request_rejection_spike"
)
)
AND OPTIONAL_CONFIDENCE_INCREASE WITHIN ENV_RESOURCE_IMPACT_WINDOW (
ResourceOrAppEvent AS RelatedResourceImpact
WHERE RelatedResourceImpact.Service IN SAME_SERVICE(HTTP2EdgeOriginPressure.DestinationAsset)
AND RelatedResourceImpact.EventPattern IN ANY (
"memory_pressure",
"cpu_pressure",
"worker_exhaustion",
"event_loop_delay",
"queue_growth",
"pod_restart",
"container_eviction",
"node_pressure",
"autoscaling_surge",
"application_error_increase",
"user_facing_degradation"
)
)
AND NOT ChangeContext IN ANY (
"approved_load_testing",
"approved_performance_testing",
"approved_resilience_testing",
"approved_synthetic_monitoring",
"approved_vulnerability_scanning",
"approved_deployment",
"approved_failover",
"approved_backend_maintenance",
"approved_cdn_change",
"approved_waf_change",
"approved_ingress_change",
"approved_service_mesh_change",
"approved_security_testing",
"approved_incident_response"
)
Rule
HTTP/2 Resource-Exhaustion Traffic Pattern Affecting Business-Critical Routes
Rule Format
NDR behavioral route-impact correlation rule suitable for network-flow telemetry, HTTP metadata, TLS metadata, CDN logs, WAF logs, proxy logs, load-balancer logs, API-gateway logs, ingress telemetry, service-mesh telemetry, route inventory, application criticality enrichment, resource telemetry, application performance telemetry, cloud telemetry, Kubernetes telemetry, change-control records, and SIEM correlation after business-route validation, traffic-baseline validation, protocol-field validation, service-impact validation, timing-window tuning, and environment-specific allowlisting.
Detection Purpose
· Detect HTTP/2 traffic patterns that create resource-exhaustion pressure or service degradation on business-critical routes.
· Identify route-targeted behavior involving request cancellation, stream reset behavior, header-limit activity, frame-limit activity, protocol errors, request rejection, connection persistence, or low transaction-success ratio.
· Prioritize exposed application paths where degradation creates material business impact, including authentication, APIs, customer portals, payment workflows, SaaS front ends, cloud ingress, Kubernetes ingress, and service-mesh ingress.
· Support escalation when route-targeted HTTP/2 anomalies align with memory pressure, worker exhaustion, gateway instability, backend retries, autoscaling events, target-health degradation, application latency, or user-facing errors.
· Preserve separation between suspicious route impact and confirmed exploitation by requiring supporting source, protocol, resource, service-impact, change-control, or incident-response evidence before classifying activity as probable exploitation.
· This rule does not prove HTTP/2 exploitation, memory exhaustion, application compromise, credential exposure, lateral movement, or actor attribution without supporting telemetry.
Detection Logic
· Identify inbound HTTP/2 traffic to business-critical routes, listeners, virtual hosts, origins, API paths, ingress paths, service-mesh routes, or application services.
· Prioritize traffic patterns that create disproportionate server-side work relative to completed requests, successful transactions, response volume, or normal route baseline.
· Prioritize abnormal request cancellation, high stream reset ratio, high incomplete stream ratio, high connection persistence, high request rejection, repeated protocol errors, header-limit events, frame-limit events, or request-to-response imbalance.
· Increase confidence when affected routes show memory pressure, CPU pressure, worker exhaustion, queue growth, event-loop delay, gateway errors, backend latency, target-health degradation, pod restart, container eviction, autoscaling surge, or application error increase.
· Increase confidence when similar route-targeted behavior appears across multiple edge nodes, origins, regions, tenants, or service tiers.
· Increase confidence when there is no approved operational activity that explains the traffic or impact.
· Reduce severity when the route impact aligns with approved load testing, performance testing, synthetic monitoring, resilience testing, vulnerability scanning, deployment activity, failover activity, partner integration behavior, approved security testing, or known traffic growth.
· Do not treat business-critical route impact, traffic volume, request rejection, or route latency as HTTP/2 exploitation without supporting protocol, source, resource, and operational-context evidence.
· Do not use CVE identifiers, proof-of-concept names, user agents, source IPs, or static indicators as the primary detection model.
Required Telemetry
· Network-flow telemetry.
· HTTP metadata where available.
· TLS metadata.
· DNS telemetry where available.
· CDN logs where available.
· WAF logs where available.
· Proxy logs where available.
· Load-balancer logs.
· API-gateway logs where available.
· Ingress-controller logs where available.
· Service-mesh telemetry where available.
· HTTP protocol version.
· Source IP.
· Source autonomous system.
· Source geolocation.
· User agent where available.
· TLS fingerprint where available.
· Client fingerprint where available.
· Virtual host.
· Route.
· Listener.
· Origin.
· Business service.
· Tenant where available.
· Request count.
· Connection count.
· Stream count where available.
· Stream reset count where available.
· Request cancellation count where available.
· Completed request count where available.
· Response code.
· Request rejection reason where available.
· Header-limit event where available.
· Frame-limit event where available.
· Protocol-error event where available.
· Request timing.
· Response timing.
· Backend latency.
· Application latency.
· Byte count.
· Target-health state where available.
· Autoscaling telemetry where available.
· Resource telemetry where available.
· Application performance telemetry where available.
· Kubernetes telemetry where available.
· Cloud telemetry where available.
· Route criticality inventory.
· Application ownership inventory.
· Approved route baseline.
· Approved testing records.
· Change-control records.
· Incident-response records.
Engineering Implementation Instructions
· Build business-critical route groups covering authentication, APIs, payment workflows, customer portals, SaaS front ends, cloud ingress paths, Kubernetes ingress paths, service-mesh ingress paths, administrative portals, and high-value application services.
· Build route-baseline groups for normal HTTP/2 request volume, connection reuse, stream reset rate, request cancellation rate, request rejection rate, response-code distribution, backend latency, application latency, and transaction-success ratio.
· Build HTTP/2 route-anomaly groups covering high stream churn, high stream reset ratio, high request cancellation ratio, high incomplete stream ratio, high connection persistence, repeated protocol errors, repeated header-limit events, repeated frame-limit events, and request-to-response imbalance.
· Build service-impact groups covering memory pressure, CPU pressure, worker exhaustion, queue growth, event-loop delay, gateway errors, target-health degradation, backend latency, pod restart, container eviction, autoscaling surge, application error increase, and user-facing degradation.
· Build source-context groups covering distributed source behavior, repeated source clusters, rare autonomous systems, unusual geographies, hosting providers, proxy networks, unusual TLS fingerprints, and abnormal client fingerprints.
· Validate whether NDR, HTTP, TLS, CDN, WAF, proxy, load-balancer, API-gateway, ingress, service-mesh, resource, cloud, Kubernetes, application, and SIEM telemetry can reliably join on route, listener, origin, source, protocol version, timestamp, business service, and response state.
· Use short correlation windows for intense route-targeted anomalies affecting business-critical services.
· Use moderate correlation windows when route-targeted anomalies are lower-rate but align with resource pressure or service-impact telemetry.
· Use longer correlation windows only when repeated route targeting, retained protocol telemetry, incident-response evidence, or application-impact evidence supports delayed linkage.
· Add severity weighting for business-critical route class, authentication path impact, API impact, payment workflow impact, customer-facing impact, high reset ratio, low completion ratio, resource pressure, service degradation, and absence of approved operational activity.
· Build allowlists for approved load testing, performance testing, resilience testing, synthetic monitoring, vulnerability scanning, partner integrations, deployments, failovers, traffic-growth events, security testing, and incident-response activity.
· Treat business-critical route degradation as a priority amplifier, not standalone proof of HTTP/2 exploitation.
· Validate all route groups, baselines, response-code mappings, timing windows, enrichment fields, exception logic, parser behavior, join logic, and local schema mappings before production deployment.
· Do not enable alert mode until business-route inventory, route baselines, protocol fields, service-impact visibility, false-positive rate, query performance, enrichment availability, exception handling, change-control integration, and SOC triage workflow are validated.
DRI Assessment
DRI
8.1 / 10
· The rule is behaviorally anchored to durable route-targeted HTTP/2 resource-exhaustion behavior and business-impact correlation rather than static indicators, CVE identifiers, proof-of-concept names, user agents, or source IPs.
· The rule remains useful if an adversary changes traffic rate, source distribution, user agent, request timing, route sequence, stream behavior mix, or HTTP/2 abuse variant.
· The score is supported by the durability of request cancellation, stream reset behavior, request rejection, protocol errors, traffic imbalance, resource pressure, and route-level impact against business-critical services.
· The score is constrained by legitimate traffic spikes, load testing, synthetic monitoring, vulnerability scanning, security testing, deployments, incomplete route baselines, weak application ownership mapping, and limited HTTP/2 telemetry.
· The rule is durable as a route-impact and resource-exhaustion detector but should not be treated as standalone proof of exploitation or compromise.
TCR Assessment
Operational TCR
7.4 / 10
Full-Telemetry TCR
8.7 / 10
· Operational confidence depends on accurate business-route inventory, HTTP/2 protocol visibility, route baselines, response-code telemetry, source context, resource telemetry, application telemetry, and SIEM correlation quality.
· Operational confidence is reduced where business-route mapping is incomplete, HTTP/2 metadata is unavailable, CDN or WAF logs are sampled, or application telemetry cannot be tied to route-level impact.
· Operational confidence is reduced during load testing, synthetic monitoring, vulnerability scanning, security testing, deployment activity, failover, traffic growth, partner integration changes, or application performance incidents.
· Full-telemetry confidence improves when NDR data is enriched with CDN logs, WAF logs, proxy logs, load-balancer logs, API-gateway logs, ingress logs, service-mesh telemetry, resource telemetry, cloud logs, Kubernetes logs, application performance telemetry, and change-control records.
· Even under full telemetry conditions, this rule should support high-priority investigation and exposure scoping rather than standalone confirmation of exploit success.
Limitations
· Business-critical route degradation can result from normal customer traffic, application regressions, backend dependency failures, deployments, failovers, security testing, or load testing.
· Weak route inventory or application ownership mapping can reduce confidence.
· CDN, WAF, proxy, and load-balancer layers may mask source behavior or normalize route-level anomalies.
· NDR may not observe frame-level HTTP/2 behavior in encrypted or proxied traffic.
· The rule may miss attacks that affect low-visibility routes or are absorbed by upstream mitigations.
· The rule may miss low-and-slow behavior that degrades service without breaching route-level thresholds.
· The rule should not be used for actor attribution without incident-specific intelligence, validated behavioral correlation, or confirmed victim-environment evidence.
Detection Query Pattern
NDR HTTP/2 business-critical route impact query pattern requiring platform syntax validation, route inventory validation, business-critical route enrichment, HTTP/2 field validation, service-impact validation, route-baseline validation, timing-window tuning, approved operational allowlisting, and environment-specific false-positive testing before production deployment.
NetworkEvent AS HTTP2BusinessRouteImpact
WHERE HTTP2BusinessRouteImpact.DestinationAsset IN ASSET_GROUP (
"HTTP/2 Web Servers",
"Reverse Proxies",
"API Gateways",
"WAF Protected Applications",
"Load Balancer Targets",
"CDN Origins",
"Kubernetes Ingress Controllers",
"Service Mesh Ingress Gateways",
"Application Front Ends"
)
AND HTTP2BusinessRouteImpact.ProtocolVersion IN ANY (
"HTTP/2",
"h2",
"h2c"
)
AND HTTP2BusinessRouteImpact.Route IN ROUTE_GROUP (
"Authentication Routes",
"API Routes",
"Payment Routes",
"Customer Portals",
"SaaS Front Ends",
"Cloud Ingress Routes",
"Kubernetes Ingress Routes",
"Service Mesh Ingress Routes",
"Business Critical Services"
)
AND (
HTTP2BusinessRouteImpact.BehaviorPattern IN ANY (
"high_stream_churn",
"high_stream_reset_ratio",
"high_request_cancellation_ratio",
"high_incomplete_stream_ratio",
"high_connection_persistence",
"request_response_imbalance",
"low_completed_request_ratio",
"repeated_protocol_errors",
"repeated_header_limit_events",
"repeated_frame_limit_events",
"request_rejection_spike"
)
OR HTTP2BusinessRouteImpact.ResponsePattern IN ANY (
"elevated_400",
"elevated_413",
"elevated_431",
"elevated_499",
"elevated_502",
"elevated_503",
"elevated_504",
"upstream_timeout_increase",
"gateway_timeout_increase"
)
)
AND OPTIONAL_CONFIDENCE_INCREASE WITHIN ENV_ROUTE_IMPACT_WINDOW (
ServiceImpactEvent AS RelatedRouteImpact
WHERE RelatedRouteImpact.Route IN SAME_ROUTE(HTTP2BusinessRouteImpact.Route)
AND RelatedRouteImpact.EventPattern IN ANY (
"memory_pressure",
"cpu_pressure",
"worker_exhaustion",
"queue_growth",
"event_loop_delay",
"gateway_error_increase",
"target_health_degradation",
"backend_latency_increase",
"pod_restart",
"container_eviction",
"autoscaling_surge",
"application_error_increase",
"user_facing_degradation"
)
)
AND OPTIONAL_CONFIDENCE_INCREASE WITHIN ENV_SOURCE_CONTEXT_WINDOW (
NetworkEvent AS RelatedSourceContext
WHERE RelatedSourceContext.Route IN SAME_ROUTE(HTTP2BusinessRouteImpact.Route)
AND RelatedSourceContext.SourceContext IN ANY (
"distributed_source_behavior",
"repeated_source_cluster",
"rare_autonomous_system",
"unusual_geography",
"hosting_provider_source",
"proxy_network_source",
"unusual_tls_fingerprint",
"abnormal_client_fingerprint"
)
)
AND NOT ChangeContext IN ANY (
"approved_load_testing",
"approved_performance_testing",
"approved_resilience_testing",
"approved_synthetic_monitoring",
"approved_vulnerability_scanning",
"approved_partner_integration",
"approved_deployment",
"approved_failover",
"approved_traffic_growth_event",
"approved_security_testing",
"approved_incident_response"
)
SentinelOne
Detection Viability Assessment
SentinelOne has three rules for this EXP report.
· SentinelOne is viable for detecting host-side and workload-side evidence associated with HTTP/2 header abuse and memory exhaustion across web infrastructure, including memory pressure, worker failure, process instability, service restart, container instability, suspicious administrative activity, unauthorized configuration changes, and conditional post-exploitation validation.
· SentinelOne is strongest on systems that terminate, proxy, inspect, route, or support HTTP/2 traffic, including internet-facing web servers, reverse proxies, API gateways, WAF nodes, load-balancer targets, CDN origins, Kubernetes ingress controllers, service-mesh ingress gateways, application front ends, and supporting container or cloud workloads.
· SentinelOne is not the primary source for detecting HTTP/2 frame-level behavior, CONTINUATION-frame sequences, Rapid Reset-style request cancellation, HPACK processing behavior, stream lifecycle behavior, or network-source clustering unless that context is enriched from proxy, WAF, CDN, ingress, service-mesh, NDR, SIEM, or application telemetry.
· SentinelOne provides high-value confirmation when abnormal HTTP/2 traffic aligns with process memory growth, worker exhaustion, process restart, crash behavior, container restart, suspicious administrative activity, configuration tampering, credential access, or unexpected service-control actions on affected infrastructure.
· SentinelOne detections must avoid implying that HTTP/2 resource exhaustion inherently creates compromise, persistence, lateral movement, credential access, or actor attribution. Host-side events should be treated as supporting evidence unless correlated with HTTP/2-facing infrastructure context and external protocol or service-impact telemetry.
· SentinelOne rules should not generate high-confidence alerting from one crash, one restart, one memory spike, one shell execution, one diagnostic command, one configuration reload, or one service-control event without supporting protocol, source, resource, route, service-impact, operational-context, or incident-response evidence.
Rule
HTTP/2-Facing Web Infrastructure Memory Pressure and Process Instability
Rule Format
SentinelOne behavioral process, memory, and service-instability correlation rule suitable for endpoint telemetry, workload telemetry, process telemetry, service telemetry, container telemetry, resource telemetry, crash telemetry, web-service inventory, HTTP/2-facing asset inventory, proxy or gateway context, application criticality enrichment, change-control records, and SIEM correlation after asset-role validation, process-baseline validation, memory-baseline validation, restart-baseline validation, timing-window tuning, and environment-specific allowlisting.
Detection Purpose
· Detect memory pressure, worker exhaustion, process instability, crash behavior, or service restart activity on HTTP/2-facing web infrastructure during or shortly after abnormal HTTP/2 traffic.
· Identify affected web servers, reverse proxies, API gateways, WAF nodes, load-balancer targets, CDN origins, Kubernetes ingress controllers, service-mesh ingress gateways, and application front ends showing host-side or workload-side resource impact.
· Support escalation when process instability aligns with HTTP/2 protocol anomalies, source clustering, request cancellation, stream reset behavior, backend retry expansion, route degradation, target-health degradation, or application-impact telemetry.
· Preserve separation between resource exhaustion and confirmed compromise by requiring supporting protocol, source, service-impact, change-control, or incident-response evidence before classifying activity as probable exploitation.
· This rule does not prove HTTP/2 exploitation, memory-exhaustion cause, application compromise, host compromise, persistence, lateral movement, credential exposure, or actor attribution without supporting telemetry.
Detection Logic
· Identify processes associated with HTTP/2-facing infrastructure, including web-server processes, reverse-proxy workers, API-gateway workers, WAF components, load-balancer targets, ingress-controller processes, service-mesh proxy processes, application workers, container entrypoints, and supervisor processes.
· Prioritize memory growth, CPU pressure, worker exhaustion, event-loop delay, queue growth, thread-pool saturation, file-descriptor pressure, crash behavior, process restart, service restart, container restart, pod eviction, or out-of-memory behavior affecting HTTP/2-facing assets.
· Prioritize instability occurring during or shortly after abnormal HTTP/2 traffic, including CONTINUATION-frame anomalies, request cancellation, stream reset behavior, high stream churn, protocol errors, header-limit events, frame-limit events, or request rejection patterns where enriched telemetry is available.
· Increase confidence when affected assets support authentication paths, API routes, payment workflows, customer portals, SaaS front ends, cloud ingress paths, Kubernetes ingress paths, service-mesh ingress paths, or other business-critical services.
· Increase confidence when process instability aligns with reverse-proxy errors, WAF anomalies, CDN-to-origin errors, API-gateway errors, load-balancer target-health degradation, ingress-controller instability, service-mesh retry expansion, application latency, or user-facing service degradation.
· Increase confidence when similar host-side instability appears across multiple HTTP/2-facing assets, edge nodes, regions, origins, routes, tenants, applications, or service tiers.
· Reduce severity when the activity aligns with approved deployment, service restart, configuration reload, performance testing, resilience testing, load testing, synthetic monitoring, vulnerability scanning, failover, autoscaling, maintenance, security testing, or incident-response activity.
· Do not classify memory pressure, process restart, worker crash, service reload, or container instability as probable HTTP/2 exploitation without supporting protocol, source, route, service-impact, or operational-context evidence.
· Do not infer host compromise, persistence, credential access, or lateral movement from resource-exhaustion symptoms alone.
Required Telemetry
· SentinelOne endpoint telemetry.
· Process creation telemetry.
· Process termination telemetry.
· Process restart telemetry where available.
· Service start and stop telemetry.
· Command-line telemetry.
· Parent-child process lineage.
· Process memory telemetry where available.
· Process CPU telemetry where available.
· Host memory telemetry where available.
· Host CPU telemetry where available.
· Thread or worker telemetry where available.
· File-descriptor telemetry where available.
· Crash telemetry.
· Out-of-memory telemetry where available.
· Container runtime telemetry where available.
· Pod restart telemetry where available.
· Workload identity where available.
· Host identity.
· User identity.
· Service account identity.
· Process hash where available.
· Process path.
· Process signer where available.
· Web-service inventory.
· HTTP/2-facing asset inventory.
· Container and pod inventory where available.
· Kubernetes namespace and service context where available.
· Application ownership inventory.
· Business-critical service inventory.
· Proxy, WAF, CDN, ingress, service-mesh, NDR, SIEM, or application telemetry enrichment where available.
· Approved deployment records.
· Approved maintenance records.
· Approved testing records.
· Change-control records.
· Incident-response records.
Engineering Implementation Instructions
· Build asset groups covering HTTP/2-facing web servers, reverse proxies, API gateways, WAF nodes, load-balancer targets, CDN origins, Kubernetes ingress controllers, service-mesh ingress gateways, application front ends, container workloads, and cloud workloads.
· Build process groups covering web-server binaries, reverse-proxy workers, API-gateway processes, WAF services, ingress-controller processes, service-mesh proxies, application runtimes, container entrypoints, supervisor processes, service managers, and recovery scripts.
· Build instability groups covering abnormal memory growth, CPU pressure, worker exhaustion, crash behavior, service restart, process restart, service reload, container restart, pod eviction, out-of-memory behavior, and event-loop delay where available.
· Build enrichment groups for abnormal HTTP/2 traffic windows, source clustering, request cancellation, stream reset behavior, backend retry expansion, gateway errors, target-health degradation, application latency, and user-facing service impact.
· Validate whether SentinelOne telemetry can be joined with proxy, WAF, CDN, load-balancer, API-gateway, ingress, service-mesh, NDR, application, cloud, Kubernetes, resource, and SIEM telemetry on host, workload, service, route, origin, timestamp, and application context.
· Use short correlation windows when process instability occurs during active HTTP/2 anomaly windows.
· Use moderate correlation windows when process instability follows lower-rate HTTP/2 anomalies but aligns with service degradation or resource telemetry.
· Use longer correlation windows only when retained protocol telemetry, incident-response evidence, application-impact evidence, or workload lineage supports delayed linkage.
· Add severity weighting for business-critical service role, repeated process instability, out-of-memory behavior, worker exhaustion, service restart loops, route degradation, application impact, and absence of approved operational activity.
· Build allowlists for approved deployments, service restarts, configuration reloads, maintenance, load testing, resilience testing, synthetic monitoring, vulnerability scanning, performance testing, failovers, autoscaling events, security testing, and incident-response actions.
· Treat process instability as a resource-impact indicator, not standalone proof of HTTP/2 exploitation.
· Validate all asset groups, process groups, memory baselines, restart baselines, timing windows, enrichment fields, exception logic, join logic, and local schema mappings before production deployment.
· Do not enable alert mode until HTTP/2-facing asset inventory, process baselines, resource baselines, enrichment availability, false-positive rate, query performance, exception handling, change-control integration, and SOC triage workflow are validated.
DRI Assessment
DRI
7.8 / 10
· The rule is behaviorally anchored to durable host-side resource and process-instability outcomes that can occur when HTTP/2-facing infrastructure is stressed.
· The rule remains useful if an adversary changes source infrastructure, user agent, request timing, HTTP/2 abuse variant, or route selection because it focuses on affected infrastructure behavior rather than external indicators.
· The score is supported by the durability of memory pressure, worker exhaustion, process restart, service restart, crash behavior, and container instability on HTTP/2-facing assets.
· The score is constrained by the fact that endpoint telemetry does not directly observe HTTP/2 frame-level behavior and many benign operational events can produce similar process or service instability.
· The rule is durable as a resource-impact and instability detector but should not be treated as standalone proof of HTTP/2 exploitation or compromise.
TCR Assessment
Operational TCR
7.2 / 10
Full-Telemetry TCR
8.5 / 10
· Operational confidence depends on accurate HTTP/2-facing asset inventory, process baselines, resource baselines, crash visibility, container visibility, enrichment from edge telemetry, and SIEM correlation quality.
· Operational confidence is reduced where memory telemetry is unavailable, process restart context is incomplete, workload identity is missing, or proxy / WAF / CDN / ingress telemetry cannot be correlated to the affected host.
· Operational confidence is reduced during deployments, maintenance, failovers, autoscaling, service restarts, configuration reloads, load testing, synthetic monitoring, vulnerability scanning, performance testing, security testing, or incident response.
· Full-telemetry confidence improves when SentinelOne data is enriched with proxy logs, CDN logs, WAF logs, load-balancer logs, API-gateway logs, ingress logs, service-mesh telemetry, NDR telemetry, application performance telemetry, cloud telemetry, Kubernetes telemetry, and change-control records.
· Even under full telemetry conditions, this rule should support escalation and impact validation rather than standalone confirmation of exploit success.
Limitations
· SentinelOne does not natively confirm HTTP/2 frame-level exploitation without enrichment from protocol-aware edge telemetry.
· Memory pressure, service restarts, process crashes, and container restarts can result from deployments, failovers, application defects, backend dependency issues, load testing, synthetic monitoring, vulnerability scanning, security testing, or normal traffic surges.
· The rule may miss attacks that are absorbed by CDN, WAF, proxy, or load-balancer controls before affecting monitored hosts.
· The rule may miss low-and-slow activity that does not create visible resource pressure or process instability.
· The rule requires accurate HTTP/2-facing asset inventory and service ownership mapping to avoid broad false positives.
· The rule cannot independently distinguish denial-of-service impact from compromise without process, file, identity, cloud, Kubernetes, and incident-response evidence.
· The rule should not be used for actor attribution without incident-specific intelligence, validated behavioral correlation, or confirmed victim-environment evidence.
Detection Query Pattern
SentinelOne HTTP/2-facing web infrastructure memory pressure and process instability query pattern requiring platform syntax validation, asset-role validation, process-baseline validation, memory-baseline validation, HTTP/2 enrichment validation, timing-window tuning, approved operational allowlisting, and environment-specific false-positive testing before production deployment.
EndpointEvent AS HTTP2FacingProcessInstability
WHERE HTTP2FacingProcessInstability.EndpointAsset IN ASSET_GROUP (
"HTTP/2 Web Servers",
"Reverse Proxies",
"API Gateways",
"WAF Nodes",
"Load Balancer Targets",
"CDN Origins",
"Kubernetes Ingress Controllers",
"Service Mesh Ingress Gateways",
"Application Front Ends",
"Container Workloads",
"Cloud Workloads"
)
AND HTTP2FacingProcessInstability.ProcessContext IN PROCESS_GROUP (
"Web Server Processes",
"Reverse Proxy Workers",
"API Gateway Processes",
"WAF Services",
"Ingress Controller Processes",
"Service Mesh Proxy Processes",
"Application Runtime Processes",
"Container Entrypoints",
"Supervisor Processes",
"Service Managers"
)
AND HTTP2FacingProcessInstability.EventPattern IN ANY (
"memory_pressure",
"cpu_pressure",
"worker_exhaustion",
"event_loop_delay",
"queue_growth",
"file_descriptor_pressure",
"process_crash",
"process_restart",
"service_restart",
"service_reload",
"container_restart",
"pod_eviction",
"out_of_memory_behavior"
)
AND OPTIONAL_CONFIDENCE_INCREASE WITHIN ENV_HTTP2_ANOMALY_WINDOW (
EdgeOrNetworkEvent AS RelatedHTTP2Anomaly
WHERE RelatedHTTP2Anomaly.Asset IN SAME_SERVICE_LINEAGE(HTTP2FacingProcessInstability.EndpointAsset)
AND RelatedHTTP2Anomaly.BehaviorPattern IN ANY (
"continuation_frame_anomaly",
"request_cancellation_spike",
"high_stream_reset_ratio",
"high_stream_churn",
"repeated_protocol_errors",
"repeated_header_limit_events",
"repeated_frame_limit_events",
"request_rejection_spike",
"source_cluster_anomaly"
)
)
AND OPTIONAL_CONFIDENCE_INCREASE WITHIN ENV_SERVICE_IMPACT_WINDOW (
ServiceImpactEvent AS RelatedServiceImpact
WHERE RelatedServiceImpact.Asset IN SAME_SERVICE_LINEAGE(HTTP2FacingProcessInstability.EndpointAsset)
AND RelatedServiceImpact.EventPattern IN ANY (
"gateway_error_increase",
"backend_latency_increase",
"target_health_degradation",
"autoscaling_surge",
"application_error_increase",
"user_facing_degradation",
"route_level_degradation"
)
)
AND NOT ChangeContext IN ANY (
"approved_deployment",
"approved_service_restart",
"approved_configuration_reload",
"approved_maintenance",
"approved_load_testing",
"approved_performance_testing",
"approved_resilience_testing",
"approved_synthetic_monitoring",
"approved_vulnerability_scanning",
"approved_failover",
"approved_autoscaling_event",
"approved_security_testing",
"approved_incident_response"
)
Rule
Suspicious Administrative or Shell Activity on HTTP/2-Affected Web Infrastructure
Rule Format
SentinelOne behavioral host-activity correlation rule suitable for endpoint telemetry, process telemetry, command-line telemetry, file telemetry, identity telemetry, service telemetry, HTTP/2-facing asset inventory, service-impact enrichment, change-control records, and SIEM correlation after asset-role validation, administrative-baseline validation, approved-operations validation, timing-window tuning, and environment-specific allowlisting.
Detection Purpose
· Detect suspicious shell activity, administrative execution, diagnostic tooling, or unauthorized process behavior on HTTP/2-affected web infrastructure during or after suspected HTTP/2 resource-exhaustion activity.
· Identify host-side behavior that may indicate manual response activity, unauthorized investigation, opportunistic follow-on activity, or post-event tampering on affected systems.
· Support escalation when suspicious process execution aligns with abnormal HTTP/2 traffic, process instability, service degradation, unauthorized configuration changes, credential access, or cloud / Kubernetes activity.
· Preserve separation between operational response and malicious activity by requiring change-control, approved incident-response, or administrative context before escalation.
· This rule does not prove HTTP/2 exploitation, host compromise, credential theft, persistence, lateral movement, or actor attribution without supporting telemetry.
Detection Logic
· Identify command execution on HTTP/2-facing or HTTP/2-affected web infrastructure during or after abnormal HTTP/2 traffic or service-impact windows.
· Prioritize shells, scripting engines, remote administration tools, diagnostic utilities, service-control utilities, archive tools, network tools, credential-access utilities, cloud CLIs, Kubernetes CLIs, container runtime commands, and file-transfer tools executed by unexpected users or processes.
· Prioritize process execution launched from web-service workers, reverse-proxy processes, API-gateway processes, ingress-controller processes, service-mesh proxy processes, application runtimes, container entrypoints, service accounts, or workload identities outside expected operational patterns.
· Increase confidence when suspicious process activity follows memory pressure, process crash, service restart, container restart, pod eviction, gateway instability, route degradation, or user-facing service impact.
· Increase confidence when activity includes credential access, environment inspection, secret access, configuration discovery, web-root access, crash-dump access, log collection outside approved procedures, outbound connection testing, cloud API activity, Kubernetes API activity, or deployment-control-plane interaction.
· Increase confidence when there is no approved deployment, maintenance, troubleshooting, security testing, incident-response action, or administrative change record during the activity window.
· Reduce severity when the activity matches approved incident response, approved service recovery, approved troubleshooting, approved deployment, approved maintenance, approved security testing, approved vulnerability scanning, or expected platform automation.
· Do not classify shell execution, diagnostic commands, service-control activity, cloud CLI usage, or Kubernetes CLI usage as malicious without user, process, asset, timing, change-control, and service-impact context.
· Do not infer persistence, lateral movement, credential theft, or compromise from administrative activity alone.
Required Telemetry
· SentinelOne endpoint telemetry.
· Process creation telemetry.
· Command-line telemetry.
· Parent-child process lineage.
· User identity.
· Service account identity.
· Workload identity where available.
· Host identity.
· Process path.
· Process hash where available.
· Process signer where available.
· Shell execution telemetry.
· Script execution telemetry.
· Remote administration telemetry where available.
· Service-control telemetry.
· File access telemetry where available.
· Network connection telemetry where available.
· DNS telemetry where available.
· Credential access telemetry where available.
· Cloud CLI execution telemetry where available.
· Kubernetes CLI execution telemetry where available.
· Container runtime command telemetry where available.
· HTTP/2-facing asset inventory.
· Affected service inventory.
· Application ownership inventory.
· Approved administrative baseline.
· Approved incident-response records.
· Approved troubleshooting records.
· Approved deployment records.
· Approved maintenance records.
· Approved security-testing records.
· Change-control records.
· Edge, NDR, WAF, CDN, proxy, ingress, service-mesh, application, cloud, or Kubernetes enrichment where available.
Engineering Implementation Instructions
· Build asset groups for HTTP/2-facing and HTTP/2-affected web infrastructure, including web servers, reverse proxies, API gateways, WAF nodes, load-balancer targets, CDN origins, Kubernetes ingress controllers, service-mesh ingress gateways, application front ends, container workloads, and cloud workloads.
· Build process-origin groups for web-service workers, reverse-proxy workers, API-gateway workers, ingress-controller processes, service-mesh proxy processes, application runtimes, container entrypoints, service accounts, workload identities, and service managers.
· Build suspicious-command groups covering shells, scripting engines, diagnostic tools, service-control utilities, archive tools, network tools, credential-access utilities, cloud CLIs, Kubernetes CLIs, container runtime tools, and file-transfer utilities.
· Build approved-operation groups for deployment automation, maintenance workflows, platform automation, vulnerability scanning, security testing, troubleshooting, service recovery, and incident response.
· Build enrichment groups for abnormal HTTP/2 traffic windows, memory pressure, process instability, service restart, gateway errors, route degradation, backend latency, user-facing impact, unauthorized configuration changes, and credential-access indicators.
· Validate whether SentinelOne telemetry can join with edge, NDR, WAF, CDN, proxy, load-balancer, API-gateway, ingress, service-mesh, application, cloud, Kubernetes, and SIEM telemetry on host, process, user, service, route, timestamp, and affected application context.
· Use short correlation windows when suspicious process activity occurs during active service degradation or immediately after process instability.
· Use moderate correlation windows when administrative activity follows lower-rate HTTP/2 anomalies or delayed response actions.
· Use longer correlation windows only when incident-response evidence, retained protocol telemetry, or workload lineage supports delayed linkage.
· Add severity weighting for unexpected parent process, unexpected user, service-account misuse, credential-access indicators, secret access, cloud CLI activity, Kubernetes CLI activity, deployment-control-plane access, business-critical service impact, and absence of approved operational records.
· Build allowlists for approved incident response, troubleshooting, maintenance, deployments, platform automation, security testing, vulnerability scanning, service recovery, autoscaling, and routine administrative workflows.
· Treat suspicious administrative execution as conditional post-event validation, not standalone proof of HTTP/2 exploitation.
· Validate all process groups, command groups, user baselines, service-account baselines, timing windows, enrichment fields, exception logic, and local schema mappings before production deployment.
· Do not enable alert mode until approved-operations baselines, user baselines, process baselines, enrichment availability, false-positive rate, query performance, exception handling, change-control integration, and SOC triage workflow are validated.
DRI Assessment
DRI
7.6 / 10
· The rule is behaviorally anchored to suspicious administrative or shell activity on HTTP/2-facing infrastructure during or after resource-exhaustion events.
· The rule remains useful if an adversary changes source infrastructure, HTTP/2 abuse method, route targeting, user agent, or traffic timing because it focuses on host-side follow-on behavior.
· The score is supported by the durability of unexpected shell execution, administrative tooling, credential-access behavior, cloud CLI usage, Kubernetes CLI usage, and service-control activity on affected infrastructure.
· The score is constrained by legitimate troubleshooting, incident response, service recovery, security testing, deployment automation, maintenance activity, and normal platform operations.
· The rule is durable as a conditional host-activity detector but should not be treated as standalone proof of HTTP/2 exploitation or compromise.
TCR Assessment
Operational TCR
7.0 / 10
Full-Telemetry TCR
8.3 / 10
· Operational confidence depends on accurate HTTP/2-facing asset inventory, user baselines, service-account baselines, process baselines, command-line visibility, change-control integration, and SIEM correlation quality.
· Operational confidence is reduced where approved operational activity is not well documented or where platform automation commonly runs diagnostic, service-control, cloud, Kubernetes, or recovery commands.
· Operational confidence is reduced during incident response, troubleshooting, deployments, maintenance, security testing, vulnerability scanning, service recovery, failover, or autoscaling activity.
· Full-telemetry confidence improves when SentinelOne data is enriched with HTTP/2 anomaly telemetry, proxy logs, WAF logs, CDN logs, API-gateway logs, ingress logs, service-mesh telemetry, cloud telemetry, Kubernetes telemetry, application telemetry, and incident-response records.
· Even under full telemetry conditions, this rule should support conditional escalation and post-event validation rather than standalone confirmation of compromise.
Limitations
· Administrative and shell activity may be legitimate during service degradation, incident response, troubleshooting, maintenance, deployments, failovers, or security testing.
· The rule requires strong change-control and incident-response context to avoid false positives.
· The rule may miss attacker activity that uses approved tools, compromised administrative sessions, renamed binaries, living-off-the-land behavior, or cloud-native control-plane access not visible on the endpoint.
· The rule may miss activity in containers or managed services where SentinelOne telemetry is limited.
· The rule cannot confirm HTTP/2 exploitation without external protocol or service-impact evidence.
· The rule should not infer credential theft, persistence, lateral movement, or host compromise without supporting process, file, identity, cloud, Kubernetes, or incident-response evidence.
· The rule should not be used for actor attribution without incident-specific intelligence, validated behavioral correlation, or confirmed victim-environment evidence.
Detection Query Pattern
SentinelOne suspicious administrative or shell activity on HTTP/2-affected web infrastructure query pattern requiring platform syntax validation, asset-role validation, process-origin validation, command-baseline validation, approved-operations allowlisting, timing-window tuning, and environment-specific false-positive testing before production deployment.
EndpointEvent AS HTTP2AffectedHostActivity
WHERE HTTP2AffectedHostActivity.EndpointAsset IN ASSET_GROUP (
"HTTP/2 Web Servers",
"Reverse Proxies",
"API Gateways",
"WAF Nodes",
"Load Balancer Targets",
"CDN Origins",
"Kubernetes Ingress Controllers",
"Service Mesh Ingress Gateways",
"Application Front Ends",
"Container Workloads",
"Cloud Workloads"
)
AND HTTP2AffectedHostActivity.ProcessName IN PROCESS_GROUP (
"Shells",
"Scripting Engines",
"Remote Administration Tools",
"Diagnostic Utilities",
"Service Control Utilities",
"Archive Tools",
"Network Tools",
"Credential Access Utilities",
"Cloud CLIs",
"Kubernetes CLIs",
"Container Runtime Tools",
"File Transfer Tools"
)
AND (
HTTP2AffectedHostActivity.ParentProcess IN PROCESS_GROUP (
"Web Server Processes",
"Reverse Proxy Workers",
"API Gateway Processes",
"Ingress Controller Processes",
"Service Mesh Proxy Processes",
"Application Runtime Processes",
"Container Entrypoints",
"Service Managers"
)
OR HTTP2AffectedHostActivity.UserContext IN ANY (
"unexpected_user",
"unexpected_service_account",
"unexpected_workload_identity",
"rare_admin_context"
)
OR HTTP2AffectedHostActivity.ActivityPattern IN ANY (
"credential_access_indicator",
"environment_inspection",
"secret_access",
"configuration_discovery",
"web_root_access",
"crash_dump_access",
"log_collection_outside_baseline",
"cloud_api_interaction",
"kubernetes_api_interaction",
"deployment_control_plane_interaction"
)
)
AND OPTIONAL_CONFIDENCE_INCREASE WITHIN ENV_HTTP2_IMPACT_WINDOW (
EdgeOrServiceEvent AS RelatedHTTP2Impact
WHERE RelatedHTTP2Impact.Asset IN SAME_SERVICE_LINEAGE(HTTP2AffectedHostActivity.EndpointAsset)
AND RelatedHTTP2Impact.EventPattern IN ANY (
"abnormal_http2_traffic",
"request_cancellation_spike",
"high_stream_reset_ratio",
"continuation_frame_anomaly",
"memory_pressure",
"process_instability",
"service_restart",
"gateway_error_increase",
"route_level_degradation",
"user_facing_degradation"
)
)
AND NOT ChangeContext IN ANY (
"approved_incident_response",
"approved_troubleshooting",
"approved_service_recovery",
"approved_deployment",
"approved_maintenance",
"approved_security_testing",
"approved_vulnerability_scanning",
"approved_platform_automation",
"approved_failover",
"approved_autoscaling_event"
)
Rule
Unauthorized HTTP/2 Service Configuration or Control-Plane Change After Resource-Exhaustion Event
Rule Format
SentinelOne behavioral file, configuration, service-control, and control-plane correlation rule suitable for endpoint telemetry, file telemetry, process telemetry, command-line telemetry, service telemetry, identity telemetry, cloud or Kubernetes telemetry enrichment, HTTP/2-facing asset inventory, change-control records, and SIEM correlation after configuration-baseline validation, service-control baseline validation, approved-change validation, timing-window tuning, and environment-specific allowlisting.
Detection Purpose
· Detect unauthorized configuration, service-control, or deployment-control changes affecting HTTP/2-facing web infrastructure after suspected HTTP/2 resource-exhaustion activity.
· Identify changes to web-server, reverse-proxy, API-gateway, WAF, load-balancer, ingress-controller, service-mesh, application, container, Kubernetes, or cloud configuration that may alter HTTP/2 handling, routing, limits, timeouts, buffering, or recovery behavior.
· Support escalation when configuration or control-plane changes occur after abnormal HTTP/2 traffic, service instability, process restart, crash behavior, route degradation, or user-facing impact.
· Preserve separation between approved operational recovery and suspicious tampering by requiring change-control, user, process, asset, timing, and service-impact context.
· This rule does not prove HTTP/2 exploitation, host compromise, persistence, lateral movement, credential theft, or actor attribution without supporting telemetry.
Detection Logic
· Identify file, process, service-control, configuration, or control-plane activity affecting HTTP/2-facing infrastructure during or after suspected HTTP/2 resource-exhaustion events.
· Prioritize changes to HTTP/2 handling parameters, header limits, stream limits, connection limits, timeout settings, rate limits, buffering behavior, upstream routing, origin-routing behavior, circuit-breaker settings, WAF policy, ingress configuration, service-mesh routing, application middleware, or service recovery scripts.
· Prioritize configuration changes performed by unexpected users, service accounts, workload identities, parent processes, administrative tools, cloud CLIs, Kubernetes CLIs, container runtime tools, deployment tools, or scripting engines.
· Increase confidence when the change follows memory pressure, process instability, service restart, crash behavior, container restart, pod eviction, gateway errors, target-health degradation, route-level degradation, or user-facing service impact.
· Increase confidence when the activity includes secret access, service-account token access, cloud credential access, Kubernetes configuration access, deployment manifest changes, role binding changes, image changes, or infrastructure-as-code modifications.
· Increase confidence when there is no approved change-control, deployment, incident-response, service recovery, maintenance, security testing, or platform-automation record during the activity window.
· Reduce severity when the change aligns with approved mitigation, approved incident response, approved configuration hardening, approved deployment, approved maintenance, approved platform automation, approved security testing, or documented service recovery.
· Do not classify configuration change, service restart, WAF tuning, ingress update, or service-mesh update as malicious without user, process, file, control-plane, timing, change-control, and service-impact context.
· Do not infer persistence, lateral movement, credential theft, or host compromise from configuration activity alone.
Required Telemetry
· SentinelOne endpoint telemetry.
· File creation telemetry.
· File modification telemetry.
· File deletion telemetry.
· Process creation telemetry.
· Command-line telemetry.
· Parent-child process lineage.
· Service-control telemetry.
· User identity.
· Service account identity.
· Workload identity where available.
· Host identity.
· Process path.
· Process hash where available.
· Process signer where available.
· Configuration file paths.
· Web-server configuration paths.
· Reverse-proxy configuration paths.
· API-gateway configuration paths where available.
· WAF configuration paths where available.
· Ingress-controller configuration paths where available.
· Service-mesh configuration paths where available.
· Application middleware paths where available.
· Startup and service-control paths.
· Secret-file access telemetry where available.
· Cloud credential file access telemetry where available.
· Kubernetes configuration access telemetry where available.
· Container file-system telemetry where available.
· Cloud CLI execution telemetry where available.
· Kubernetes CLI execution telemetry where available.
· Container runtime command telemetry where available.
· HTTP/2-facing asset inventory.
· Configuration baseline.
· Approved change-control records.
· Approved deployment records.
· Approved incident-response records.
· Approved maintenance records.
· Approved security-testing records.
· Edge, NDR, WAF, CDN, proxy, ingress, service-mesh, application, cloud, or Kubernetes enrichment where available.
Engineering Implementation Instructions
· Build asset groups for HTTP/2-facing and HTTP/2-affected web infrastructure, including web servers, reverse proxies, API gateways, WAF nodes, load-balancer targets, CDN origins, Kubernetes ingress controllers, service-mesh ingress gateways, application front ends, container workloads, and cloud workloads.
· Build configuration-path groups for web-server configuration, reverse-proxy configuration, API-gateway configuration, WAF policy files, load-balancer configuration where host-visible, ingress-controller configuration, service-mesh configuration, application middleware, startup paths, service-control paths, recovery scripts, and deployment artifacts.
· Build HTTP/2-control groups for header limits, stream limits, connection limits, timeout settings, buffering settings, rate limits, circuit-breaker settings, origin routing, upstream routing, HTTP/2 enablement, and service recovery behavior.
· Build suspicious-change groups for unexpected users, unexpected service accounts, unusual parent processes, shell-driven edits, scripting-engine edits, cloud CLI changes, Kubernetes CLI changes, container runtime changes, secret access, credential-file access, deployment manifest changes, role binding changes, and infrastructure-as-code changes.
· Build approved-change groups for deployments, incident response, service recovery, maintenance, platform automation, security testing, vulnerability remediation, emergency mitigation, WAF tuning, ingress updates, service-mesh updates, and configuration hardening.
· Validate whether SentinelOne telemetry can join with cloud, Kubernetes, edge, NDR, WAF, CDN, proxy, load-balancer, API-gateway, ingress, service-mesh, application, change-control, and SIEM telemetry on host, workload, service, route, configuration path, user, process, timestamp, and affected application context.
· Use short correlation windows when configuration activity occurs during active service degradation or immediately after process instability.
· Use moderate correlation windows when configuration changes follow lower-rate HTTP/2 anomalies, recovery actions, or delayed service impact.
· Use longer correlation windows only when incident-response evidence, retained protocol telemetry, workload lineage, or configuration history supports delayed linkage.
· Add severity weighting for business-critical service impact, unexpected user, unusual parent process, service-account misuse, secret access, cloud credential access, Kubernetes credential access, HTTP/2 handling changes, WAF policy changes, ingress changes, service-mesh route changes, and absence of approved change-control.
· Build allowlists for approved deployments, approved incident response, approved service recovery, approved maintenance, approved platform automation, approved security testing, approved vulnerability remediation, approved WAF tuning, approved ingress updates, approved service-mesh changes, and approved hardening activity.
· Treat configuration or control-plane change as conditional follow-on evidence, not standalone proof of HTTP/2 exploitation.
· Validate all asset groups, configuration paths, control settings, user baselines, service-account baselines, change-control joins, timing windows, enrichment fields, exception logic, and local schema mappings before production deployment.
· Do not enable alert mode until configuration baselines, change-control integration, approved-operation baselines, enrichment availability, false-positive rate, query performance, exception handling, and SOC triage workflow are validated.
DRI Assessment
DRI
7.7 / 10
· The rule is behaviorally anchored to unauthorized configuration, service-control, or control-plane changes affecting HTTP/2-facing infrastructure after resource-exhaustion events.
· The rule remains useful if an adversary changes source infrastructure, HTTP/2 abuse variant, traffic timing, user agent, or route targeting because it focuses on post-event infrastructure changes.
· The score is supported by the durability of unauthorized changes to HTTP/2 handling, limits, routing, buffering, WAF policy, ingress configuration, service-mesh configuration, and service recovery behavior.
· The score is constrained by legitimate mitigation, incident response, service recovery, WAF tuning, deployments, maintenance, platform automation, and security testing that can produce similar changes.
· The rule is durable as a conditional configuration-change detector but should not be treated as standalone proof of exploitation or compromise.
TCR Assessment
Operational TCR
7.1 / 10
Full-Telemetry TCR
8.4 / 10
· Operational confidence depends on accurate configuration baselines, HTTP/2-facing asset inventory, file telemetry, process lineage, user baselines, service-account baselines, change-control records, and SIEM correlation quality.
· Operational confidence is reduced where configuration changes are common, emergency mitigation is frequent, change-control records are incomplete, or cloud / Kubernetes control-plane changes are not visible to SentinelOne.
· Operational confidence is reduced during incident response, deployments, maintenance, platform automation, WAF tuning, ingress updates, service-mesh changes, emergency hardening, security testing, vulnerability remediation, or service recovery.
· Full-telemetry confidence improves when SentinelOne data is enriched with HTTP/2 anomaly telemetry, proxy logs, WAF logs, CDN logs, load-balancer logs, API-gateway logs, ingress logs, service-mesh telemetry, cloud telemetry, Kubernetes telemetry, application telemetry, and change-control records.
· Even under full telemetry conditions, this rule should support post-event validation and tamper review rather than standalone confirmation of exploit success.
Limitations
· Configuration and control-plane changes are common during legitimate mitigation, incident response, service recovery, deployments, maintenance, platform automation, security testing, and hardening activity.
· SentinelOne may not observe cloud-native or Kubernetes-native control-plane changes unless logs are enriched from external telemetry.
· The rule requires accurate configuration baselines and approved-change records to avoid false positives.
· The rule may miss unauthorized changes made through managed cloud services, SaaS control planes, CI/CD systems, or infrastructure-as-code platforms not visible on the endpoint.
· The rule cannot confirm HTTP/2 exploitation without external protocol or service-impact evidence.
· The rule should not infer persistence, credential theft, lateral movement, or host compromise without supporting process, file, identity, cloud, Kubernetes, or incident-response evidence.
· The rule should not be used for actor attribution without incident-specific intelligence, validated behavioral correlation, or confirmed victim-environment evidence.
Detection Query Pattern
SentinelOne unauthorized HTTP/2 service configuration or control-plane change query pattern requiring platform syntax validation, configuration-path validation, service-control baseline validation, approved-change allowlisting, timing-window tuning, HTTP/2 impact enrichment validation, and environment-specific false-positive testing before production deployment.
EndpointEvent AS HTTP2ServiceConfigChange
WHERE HTTP2ServiceConfigChange.EndpointAsset IN ASSET_GROUP (
"HTTP/2 Web Servers",
"Reverse Proxies",
"API Gateways",
"WAF Nodes",
"Load Balancer Targets",
"CDN Origins",
"Kubernetes Ingress Controllers",
"Service Mesh Ingress Gateways",
"Application Front Ends",
"Container Workloads",
"Cloud Workloads"
)
AND (
HTTP2ServiceConfigChange.FilePath IN CONFIG_GROUP (
"Web Server Configuration",
"Reverse Proxy Configuration",
"API Gateway Configuration",
"WAF Policy Configuration",
"Ingress Controller Configuration",
"Service Mesh Configuration",
"Application Middleware Configuration",
"Startup Paths",
"Service Control Paths",
"Recovery Scripts",
"Deployment Artifacts"
)
OR HTTP2ServiceConfigChange.ActivityPattern IN ANY (
"http2_handling_change",
"header_limit_change",
"stream_limit_change",
"connection_limit_change",
"timeout_setting_change",
"buffering_setting_change",
"rate_limit_change",
"circuit_breaker_change",
"origin_routing_change",
"upstream_routing_change",
"waf_policy_change",
"ingress_configuration_change",
"service_mesh_route_change"
)
)
AND (
HTTP2ServiceConfigChange.UserContext IN ANY (
"unexpected_user",
"unexpected_service_account",
"unexpected_workload_identity",
"rare_admin_context"
)
OR HTTP2ServiceConfigChange.ProcessContext IN ANY (
"shell_driven_edit",
"scripting_engine_edit",
"cloud_cli_change",
"kubernetes_cli_change",
"container_runtime_change",
"unusual_parent_process"
)
OR HTTP2ServiceConfigChange.ActivityPattern IN ANY (
"secret_access",
"credential_file_access",
"kubernetes_config_access",
"service_account_token_access",
"deployment_manifest_change",
"role_binding_change",
"infrastructure_as_code_change"
)
)
AND OPTIONAL_CONFIDENCE_INCREASE WITHIN ENV_HTTP2_IMPACT_WINDOW (
EdgeOrServiceEvent AS RelatedHTTP2Impact
WHERE RelatedHTTP2Impact.Asset IN SAME_SERVICE_LINEAGE(HTTP2ServiceConfigChange.EndpointAsset)
AND RelatedHTTP2Impact.EventPattern IN ANY (
"abnormal_http2_traffic",
"request_cancellation_spike",
"high_stream_reset_ratio",
"continuation_frame_anomaly",
"memory_pressure",
"process_instability",
"service_restart",
"gateway_error_increase",
"route_level_degradation",
"user_facing_degradation"
)
)
AND NOT ChangeContext IN ANY (
"approved_deployment",
"approved_incident_response",
"approved_service_recovery",
"approved_maintenance",
"approved_platform_automation",
"approved_security_testing",
"approved_vulnerability_remediation",
"approved_waf_tuning",
"approved_ingress_update",
"approved_service_mesh_change",
"approved_configuration_hardening"
)
Splunk
Detection Viability Assessment
Splunk has three rules for this EXP report.
· Splunk is viable for detecting HTTP/2 header abuse and memory exhaustion across web infrastructure because it can correlate web, proxy, WAF, CDN, load-balancer, API-gateway, ingress, service-mesh, endpoint, resource, application, Kubernetes, cloud, and change-control telemetry into a single investigation timeline.
· Splunk is strongest where HTTP/2-facing logs expose protocol version, source context, route, listener, virtual host, response code, request result, upstream result, request rejection reason, stream reset behavior, request cancellation behavior, header-limit events, frame-limit events, retry expansion, resource pressure, application degradation, and approved operational context.
· Splunk can support durable detection engineering even when frame-level HTTP/2 telemetry is incomplete, provided rule logic correlates abnormal HTTP/2-facing behavior with source behavior, resource pressure, service impact, route sensitivity, and absence of approved operational activity.
· Splunk is not a standalone source for confirming HTTP/2 CONTINUATION-frame exploitation, Rapid Reset-style exploitation, memory exhaustion, application compromise, host compromise, persistence, lateral movement, or actor attribution unless the underlying telemetry provides sufficient protocol, endpoint, resource, application, cloud, Kubernetes, and incident-response evidence.
· Splunk detections must avoid high-confidence alerting from one HTTP error spike, one stream reset pattern, one request rejection spike, one source cluster, one memory spike, one gateway timeout, one process restart, or one autoscaling event without supporting correlation.
· Splunk rule logic should prioritize multi-signal behavior: HTTP/2 protocol anomaly plus source behavior plus resource pressure plus edge-service or application impact plus operational-context validation.
Rule
HTTP/2 Protocol Anomaly Correlated With Edge-Service Resource Pressure
Rule Format
Splunk correlation rule suitable for web logs, reverse-proxy logs, CDN logs, WAF logs, load-balancer logs, API-gateway logs, ingress-controller logs, service-mesh telemetry, NDR telemetry, endpoint telemetry, resource telemetry, application telemetry, Kubernetes telemetry, cloud telemetry, HTTP/2-enabled route inventory, asset inventory, business-critical route enrichment, change-control records, and SOC triage workflow after index validation, sourcetype validation, field mapping, timing-window tuning, baseline validation, and environment-specific allowlisting.
Detection Purpose
· Detect HTTP/2 protocol anomalies that align with resource pressure or instability on HTTP/2-facing web infrastructure.
· Identify abnormal CONTINUATION-frame behavior, request cancellation, stream reset behavior, high stream churn, header-limit events, frame-limit events, protocol errors, or request rejection patterns when they coincide with memory pressure, worker exhaustion, gateway errors, process instability, or application degradation.
· Prioritize exposed web servers, reverse proxies, API gateways, WAF-protected applications, load balancers, CDN origins, Kubernetes ingress controllers, service-mesh ingress gateways, and application front ends.
· Support escalation when protocol anomalies align with source clustering, route sensitivity, resource pressure, service impact, and absence of approved operational activity.
· Preserve separation between suspicious protocol behavior and confirmed exploitation by requiring resource, service-impact, operational-context, or incident-response evidence before classifying activity as probable exploitation.
· This rule does not prove HTTP/2 exploitation, memory exhaustion, application compromise, host compromise, persistence, lateral movement, or actor attribution without supporting telemetry.
Detection Logic
· Identify HTTP/2-facing events from web servers, reverse proxies, CDNs, WAFs, load balancers, API gateways, ingress controllers, service meshes, and application front ends.
· Prioritize events showing CONTINUATION-frame anomalies, HEADERS anomalies, RST_STREAM behavior, high stream churn, request cancellation spikes, incomplete stream ratios, protocol errors, frame-limit events, header-limit events, request rejection spikes, or low completed-request ratios where fields are available.
· Correlate protocol anomalies with resource-impact events involving memory pressure, CPU pressure, worker exhaustion, event-loop delay, queue growth, file-descriptor pressure, process crash, process restart, service restart, container restart, pod eviction, node pressure, or out-of-memory behavior.
· Increase confidence when edge-service errors, upstream timeouts, gateway errors, target-health degradation, origin errors, backend latency, autoscaling surge, application errors, or user-facing degradation occur in the same service lineage.
· Increase confidence when activity affects authentication paths, API routes, payment workflows, customer portals, SaaS front ends, cloud ingress paths, Kubernetes ingress paths, service-mesh ingress paths, or other business-critical services.
· Increase confidence when source clusters, autonomous systems, geographies, TLS fingerprints, client fingerprints, user agents, or proxy paths generate similar HTTP/2 anomaly patterns across multiple routes, regions, tenants, origins, or edge nodes.
· Reduce severity when activity aligns with approved load testing, performance testing, resilience testing, synthetic monitoring, vulnerability scanning, deployment activity, failover, autoscaling, maintenance, security testing, or incident-response activity.
· Do not classify HTTP/2 protocol anomaly, request rejection, stream reset behavior, memory pressure, process instability, or gateway error activity as probable exploitation without multi-signal correlation.
· Do not use source IPs, user agents, proof-of-concept names, scanner names, or CVE identifiers as the primary detection basis.
Required Telemetry
· Splunk index and sourcetype inventory.
· Web-server logs.
· Reverse-proxy logs.
· CDN logs where available.
· WAF logs where available.
· Load-balancer logs.
· API-gateway logs where available.
· Ingress-controller logs where available.
· Service-mesh telemetry where available.
· NDR telemetry where available.
· Endpoint telemetry where available.
· HTTP protocol version.
· Source IP.
· Source autonomous system where available.
· Source geolocation where available.
· User agent where available.
· TLS fingerprint where available.
· Client fingerprint where available.
· Virtual host.
· Route.
· Listener.
· Origin.
· Destination service.
· Business service.
· Response code.
· Request result.
· Upstream result.
· Request rejection reason where available.
· Header-limit event where available.
· Frame-limit event where available.
· Protocol-error event where available.
· Stream reset count where available.
· Request cancellation count where available.
· Completed request count where available.
· Request count.
· Connection count.
· Response time.
· Request timing.
· Byte count.
· Resource telemetry.
· Process restart telemetry where available.
· Container telemetry where available.
· Kubernetes telemetry where available.
· Cloud telemetry where available.
· Application performance telemetry.
· HTTP/2-facing asset inventory.
· Route criticality inventory.
· Change-control records.
· Approved testing records.
· Incident-response records.
Engineering Implementation Instructions
· Build Splunk macros or lookups for HTTP/2-facing assets, reverse proxies, API gateways, WAF-protected applications, load balancers, CDN origins, Kubernetes ingress controllers, service-mesh ingress gateways, application front ends, and business-critical routes.
· Normalize field names across web, proxy, CDN, WAF, load-balancer, API-gateway, ingress, service-mesh, NDR, endpoint, resource, Kubernetes, cloud, and application telemetry.
· Map protocol fields to a normalized HTTP protocol-version field.
· Map route, listener, virtual host, origin, destination service, business service, and application ownership into a common service-lineage model.
· Build protocol-anomaly fields for CONTINUATION-frame anomalies, request cancellation, stream reset behavior, high stream churn, incomplete stream ratio, request rejection, header-limit events, frame-limit events, and protocol errors where available.
· Build resource-impact fields for memory pressure, CPU pressure, worker exhaustion, event-loop delay, queue growth, process restart, service restart, container restart, pod eviction, node pressure, out-of-memory behavior, and application degradation.
· Build change-control and approved-activity lookups for load testing, performance testing, resilience testing, synthetic monitoring, vulnerability scanning, deployments, failovers, maintenance, security testing, incident response, and autoscaling.
· Use short correlation windows when protocol anomalies and resource pressure occur together on the same service lineage.
· Use moderate correlation windows when resource pressure follows lower-rate protocol anomalies.
· Use longer correlation windows only when retained protocol telemetry, incident-response evidence, application-impact telemetry, or workload lineage supports delayed linkage.
· Add severity weighting for business-critical route impact, repeated protocol anomalies, distributed source behavior, memory pressure, worker exhaustion, gateway errors, application degradation, and absence of approved operational activity.
· Validate index names, sourcetypes, CIM mapping, field extractions, lookup contents, event timestamps, time-zone handling, ingestion delay, correlation windows, exception logic, and false-positive baselines before production deployment.
· Treat Splunk correlation output as investigation-ready evidence until local rule performance, field completeness, and SOC triage workflow are validated.
· Do not enable alert mode until indexes, sourcetypes, field mappings, lookups, baselines, enrichment, exceptions, query performance, and SOC triage workflow are validated.
DRI Assessment
DRI
8.4 / 10
· The rule is behaviorally anchored to durable protocol, resource, service-impact, and operational-context correlation rather than static indicators, CVE identifiers, source IPs, user agents, or proof-of-concept names.
· The rule remains useful if an adversary changes source infrastructure, user agent, request timing, route targeting, traffic distribution, or HTTP/2 abuse variant.
· The score is supported by Splunk’s ability to correlate diverse log sources across protocol behavior, resource state, application impact, and change-control context.
· The score is constrained by field availability, telemetry gaps, inconsistent sourcetypes, incomplete HTTP/2 metadata, CDN or WAF normalization, and incomplete route-to-service lineage.
· The rule is durable as a correlation detector but should not be treated as standalone proof of exploitation without underlying telemetry support.
TCR Assessment
Operational TCR
7.8 / 10
Full-Telemetry TCR
9.0 / 10
· Operational confidence depends on accurate index mapping, sourcetype mapping, field extraction, route inventory, HTTP/2 protocol visibility, resource telemetry, application telemetry, change-control integration, and SIEM correlation quality.
· Operational confidence is reduced where HTTP/2 fields are unavailable, proxy / WAF / CDN logs are sampled, route-to-service lineage is incomplete, or resource telemetry cannot be tied to affected services.
· Operational confidence is reduced during load testing, synthetic monitoring, vulnerability scanning, deployments, failovers, maintenance, autoscaling, security testing, incident response, or legitimate traffic surges.
· Full-telemetry confidence improves when Splunk ingests normalized proxy, CDN, WAF, load-balancer, API-gateway, ingress, service-mesh, NDR, endpoint, resource, Kubernetes, cloud, application, and change-control telemetry.
· Even under full telemetry conditions, this rule should support high-confidence escalation only after field validation, timing validation, and false-positive review.
Limitations
· Splunk detection quality depends on underlying telemetry quality, field normalization, sourcetype consistency, and retention.
· Many environments do not retain frame-level HTTP/2 telemetry or expose CONTINUATION-frame behavior directly.
· CDN, WAF, load-balancer, or proxy layers may mask source behavior, route context, or origin impact.
· Resource telemetry may show pressure without proving HTTP/2 causality.
· Application degradation may result from backend dependency failures, deployments, failovers, load testing, security testing, or legitimate traffic growth.
· The rule may miss activity if protocol telemetry, resource telemetry, route mapping, or application-impact telemetry is unavailable.
· The rule should not be used for actor attribution without incident-specific intelligence, validated behavioral correlation, or confirmed victim-environment evidence.
Detection Query Pattern
Splunk HTTP/2 protocol anomaly and resource-pressure correlation query pattern requiring index validation, sourcetype validation, CIM and field mapping validation, route lineage validation, timing-window tuning, approved operational allowlisting, and false-positive testing before production deployment.
(index IN ($web_indexes$, $proxy_indexes$, $cdn_indexes$, $waf_indexes$, $lb_indexes$, $gateway_indexes$, $ingress_indexes$, $service_mesh_indexes$))
(protocol_version IN ("HTTP/2","h2","h2c") OR http_version IN ("HTTP/2","h2","h2c"))
(
http2_behavior IN (
"continuation_frame_anomaly",
"headers_anomaly",
"rst_stream_behavior",
"high_stream_churn",
"request_cancellation_spike",
"incomplete_stream_ratio",
"protocol_error_spike",
"header_limit_event",
"frame_limit_event",
"request_rejection_spike",
"low_completed_request_ratio"
)
OR response_pattern IN (
"elevated_400",
"elevated_413",
"elevated_431",
"elevated_499",
"elevated_502",
"elevated_503",
"elevated_504",
"upstream_timeout_increase",
"gateway_timeout_increase"
)
)
| eval service_lineage=coalesce(service_lineage, route, virtual_host, listener, origin, dest_service)
| stats count as http2_anomaly_count values(src_ip) as src_ip values(user_agent) as user_agent values(http2_behavior) as http2_behavior values(response_pattern) as response_pattern by service_lineage route virtual_host time span=5m
| lookup http2business_routes route OUTPUT route_sensitivity business_service
| lookup approved_operational_activity service_lineage route OUTPUT change_context
| join type=left service_lineage [
search index IN ($resource_indexes$, $endpoint_indexes$, $kubernetes_indexes$, $cloud_indexes$)
resource_event IN (
"memory_pressure",
"cpu_pressure",
"worker_exhaustion",
"event_loop_delay",
"queue_growth",
"process_restart",
"service_restart",
"container_restart",
"pod_eviction",
"node_pressure",
"out_of_memory_behavior",
"application_error_increase",
"user_facing_degradation"
)
| stats count as resource_impact_count values(resource_event) as resource_event by service_lineage time span=5m
]
| where http2anomaly_count >= $http2_anomaly_threshold$
| where resource_impact_count >= $resource_impact_threshold$ OR route_sensitivity IN ("authentication","api","payment","customer_portal","saas_front_end","business_critical")
| where isnull(change_context) OR NOT change_context IN (
"approved_load_testing",
"approved_performance_testing",
"approved_resilience_testing",
"approved_synthetic_monitoring",
"approved_vulnerability_scanning",
"approved_deployment",
"approved_failover",
"approved_autoscaling_event",
"approved_security_testing",
"approved_incident_response"
)
Rule
HTTP/2 Edge-to-Application Retry Expansion and Route Degradation
Rule Format
Splunk correlation rule suitable for CDN logs, WAF logs, reverse-proxy logs, load-balancer logs, API-gateway logs, ingress-controller logs, service-mesh telemetry, application performance telemetry, resource telemetry, cloud telemetry, Kubernetes telemetry, route inventory, service-lineage mapping, change-control records, and SOC triage workflow after route-to-service validation, retry-baseline validation, response-field mapping, timing-window tuning, and environment-specific allowlisting.
Detection Purpose
· Detect edge-to-application retry expansion, timeout growth, target-health degradation, origin withdrawal, backend saturation, or route-level degradation following suspicious HTTP/2-facing activity.
· Identify when HTTP/2 resource-exhaustion pressure propagates from edge services into origins, backend services, Kubernetes services, service-mesh upstreams, application tiers, or business-critical routes.
· Prioritize authentication routes, API routes, payment workflows, customer portals, SaaS front ends, cloud ingress paths, Kubernetes ingress paths, service-mesh ingress paths, and high-value application services.
· Support escalation when retry expansion or route degradation aligns with HTTP/2 anomalies, source clusters, resource pressure, application errors, autoscaling activity, or absence of approved operational activity.
· Preserve separation between service-impact correlation and confirmed exploitation by requiring supporting protocol, source, resource, route, change-control, or incident-response evidence before classifying activity as probable exploitation.
· This rule does not prove HTTP/2 exploitation, memory exhaustion, backend compromise, application compromise, cloud compromise, or actor attribution without supporting telemetry.
Detection Logic
· Identify edge-to-origin or gateway-to-backend communication from CDN, WAF, reverse-proxy, load-balancer, API-gateway, ingress-controller, or service-mesh layers to backend services.
· Prioritize retry expansion, timeout growth, upstream reset increase, connection refusal, backend saturation, request amplification, origin withdrawal, load-balancer target-health degradation, route latency, or application error increase.
· Correlate service-impact patterns with related HTTP/2 anomalies such as request cancellation, stream reset behavior, high stream churn, protocol errors, request rejection, header-limit events, frame-limit events, or low completed-request ratios.
· Increase confidence when route degradation affects business-critical application paths.
· Increase confidence when backend pressure aligns with memory pressure, CPU pressure, worker exhaustion, queue growth, event-loop delay, pod restart, container eviction, node pressure, autoscaling surge, or application degradation.
· Increase confidence when similar route degradation appears across multiple edge nodes, origins, regions, backend services, service tiers, routes, or tenants.
· Reduce severity when activity matches approved load testing, failover, deployment, resilience testing, synthetic monitoring, vulnerability scanning, backend maintenance, CDN change, WAF change, ingress change, service-mesh change, security testing, or incident-response activity.
· Do not classify retry expansion, gateway timeouts, route latency, origin withdrawal, or target-health degradation as HTTP/2 exploitation without supporting HTTP/2 protocol, source, route, resource, or operational-context evidence.
· Do not interpret defensive telemetry export, health-check traffic, autoscaling activity, or mitigation-control activation as adversary-controlled outbound communication without host, process, identity, destination, and incident-response evidence.
Required Telemetry
· Splunk index and sourcetype inventory.
· CDN logs where available.
· WAF logs where available.
· Reverse-proxy logs.
· Load-balancer logs.
· API-gateway logs where available.
· Ingress-controller logs where available.
· Service-mesh telemetry where available.
· Application performance telemetry.
· Resource telemetry.
· Cloud telemetry where available.
· Kubernetes telemetry where available.
· Edge node.
· Origin.
· Backend service.
· Destination service.
· Route.
· Listener.
· Virtual host.
· Response code.
· Upstream result.
· Connection result.
· Retry count where available.
· Timeout count where available.
· Connection reset count where available.
· Target-health status where available.
· Origin health status where available.
· Request count.
· Byte count.
· Response time.
· Backend latency.
· Application latency.
· Application error rate.
· Autoscaling telemetry where available.
· Route-to-service mapping.
· Business-critical route inventory.
· Origin inventory.
· Backend-service inventory.
· Approved change-control records.
· Approved testing records.
· Incident-response records.
Engineering Implementation Instructions
· Build Splunk macros or lookups for edge assets, origins, backend services, business-critical routes, Kubernetes services, service-mesh upstreams, cloud load-balancer targets, and application ownership.
· Normalize edge-to-origin fields across CDN, WAF, reverse-proxy, load-balancer, API-gateway, ingress, service-mesh, cloud, Kubernetes, application, and resource telemetry.
· Map retry, timeout, connection reset, upstream result, target-health, origin-health, route latency, and application-error fields into normalized service-impact fields.
· Build route-to-service lineage that joins virtual host, route, listener, origin, backend service, Kubernetes service, service-mesh upstream, cloud target, tenant, and business application.
· Build HTTP/2 anomaly enrichment for request cancellation, stream reset behavior, protocol errors, request rejection, header-limit events, frame-limit events, high stream churn, and low completed-request ratio.
· Build approved-activity lookups for load testing, performance testing, resilience testing, synthetic monitoring, vulnerability scanning, deployments, failovers, backend maintenance, CDN change, WAF change, ingress change, service-mesh change, security testing, and incident response.
· Use short correlation windows when retry expansion occurs during active HTTP/2 anomaly windows.
· Use moderate correlation windows when retry expansion or target-health degradation follows lower-rate HTTP/2 anomalies.
· Use longer correlation windows only when route-to-service lineage, application-impact telemetry, retained protocol telemetry, or incident-response evidence supports delayed linkage.
· Add severity weighting for business-critical route impact, repeated retry expansion, target-health degradation, origin withdrawal, backend latency, autoscaling surge, resource pressure, and absence of approved operational activity.
· Validate index names, sourcetypes, field extractions, lookups, service-lineage mapping, event timestamps, ingestion delay, timing windows, exception logic, query performance, and false-positive baselines before production deployment.
· Treat edge-to-application retry expansion as a service-impact amplifier, not standalone proof of HTTP/2 exploitation.
· Do not enable alert mode until route-to-service lineage, retry baselines, target-health visibility, backend service mapping, enrichment availability, exceptions, query performance, and SOC triage workflow are validated.
DRI Assessment
DRI
8.2 / 10
· The rule is behaviorally anchored to durable service-impact propagation from HTTP/2-facing edge infrastructure to origins, backend services, and business-critical routes.
· The rule remains useful if an adversary changes source infrastructure, traffic timing, route selection, user agent, HTTP/2 behavior mix, or attack distribution.
· The score is supported by the durability of retry expansion, timeout growth, target-health degradation, origin withdrawal, backend saturation, route latency, autoscaling surge, and application degradation.
· The score is constrained by CDN abstraction, WAF normalization, weak route-to-service lineage, backend dependency noise, deployment activity, failover activity, security testing, and application-level retry behavior.
· The rule is durable as a service-impact correlation detector but should not be treated as standalone proof of HTTP/2 exploitation.
TCR Assessment
Operational TCR
7.6 / 10
Full-Telemetry TCR
8.9 / 10
· Operational confidence depends on reliable route-to-service mapping, retry telemetry, target-health telemetry, origin inventory, backend-service inventory, application telemetry, resource telemetry, change-control records, and SIEM correlation quality.
· Operational confidence is reduced where CDN, WAF, load-balancer, API-gateway, ingress, or service-mesh telemetry is sampled, incomplete, or disconnected from backend service context.
· Operational confidence is reduced during failovers, deployments, traffic shifting, autoscaling events, resilience testing, load testing, synthetic monitoring, vulnerability scanning, backend maintenance, security testing, or incident response.
· Full-telemetry confidence improves when Splunk correlates edge-to-origin logs with HTTP/2 protocol telemetry, NDR telemetry, resource telemetry, Kubernetes events, cloud telemetry, application performance telemetry, and change-control records.
· Even under full telemetry conditions, this rule should support service-impact escalation and scoping rather than standalone confirmation of exploitation.
Limitations
· Edge-to-application retry expansion can be caused by backend dependency failures, deployment regressions, autoscaling delays, failovers, security testing, or normal traffic surges.
· CDN, WAF, load-balancer, API-gateway, and service-mesh layers may obscure the original source or normalize route-level behavior.
· Weak route-to-service mapping can reduce confidence in linking edge anomalies to backend impact.
· The rule may miss attacks fully absorbed by CDN or WAF controls before backend impact occurs.
· The rule may miss low-and-slow activity that degrades service without triggering retry or target-health thresholds.
· The rule may generate false positives if retry baselines, backend maintenance records, deployment windows, or failover records are incomplete.
· The rule should not be used for actor attribution without incident-specific intelligence, validated behavioral correlation, or confirmed victim-environment evidence.
Detection Query Pattern
Splunk HTTP/2 edge-to-application retry expansion and route degradation query pattern requiring index validation, sourcetype validation, service-lineage validation, retry-baseline validation, HTTP/2 anomaly enrichment validation, timing-window tuning, approved operational allowlisting, and false-positive testing before production deployment.
(index IN ($cdn_indexes$, $waf_indexes$, $proxy_indexes$, $lb_indexes$, $gateway_indexes$, $ingress_indexes$, $service_mesh_indexes$, $application_indexes$))
(
service_impact_pattern IN (
"retry_expansion",
"timeout_growth",
"upstream_reset_increase",
"connection_refusal_increase",
"backend_saturation",
"request_amplification",
"origin_withdrawal",
"target_health_degradation",
"backend_latency_increase",
"route_latency_increase",
"application_error_increase"
)
OR response_pattern IN (
"elevated_502",
"elevated_503",
"elevated_504",
"upstream_timeout_increase",
"gateway_timeout_increase",
"origin_error_increase",
"target_unhealthy"
)
)
| eval service_lineage=coalesce(service_lineage, route, virtual_host, origin, backend_service, dest_service)
| stats count as service_impact_count values(service_impact_pattern) as service_impact_pattern values(response_pattern) as response_pattern by service_lineage route origin backend_service time span=5m
| lookup http2business_routes route OUTPUT route_sensitivity business_service
| lookup approved_operational_activity service_lineage route OUTPUT change_context
| join type=left service_lineage [
search index IN ($web_indexes$, $proxy_indexes$, $cdn_indexes$, $waf_indexes$, $lb_indexes$, $gateway_indexes$, $ingress_indexes$, $service_mesh_indexes$)
(protocol_version IN ("HTTP/2","h2","h2c") OR http_version IN ("HTTP/2","h2","h2c"))
http2_behavior IN (
"request_cancellation_spike",
"high_stream_reset_ratio",
"high_stream_churn",
"repeated_protocol_errors",
"request_rejection_spike",
"repeated_header_limit_events",
"repeated_frame_limit_events",
"low_completed_request_ratio"
)
| stats count as http2_anomaly_count values(http2_behavior) as http2_behavior by service_lineage time span=5m
]
| where serviceimpact_count >= $service_impact_threshold$
| where http2_anomaly_count >= $http2_anomaly_threshold$ OR route_sensitivity IN ("authentication","api","payment","customer_portal","saas_front_end","business_critical")
| where isnull(change_context) OR NOT change_context IN (
"approved_load_testing",
"approved_performance_testing",
"approved_resilience_testing",
"approved_synthetic_monitoring",
"approved_vulnerability_scanning",
"approved_deployment",
"approved_failover",
"approved_backend_maintenance",
"approved_cdn_change",
"approved_waf_change",
"approved_ingress_change",
"approved_service_mesh_change",
"approved_security_testing",
"approved_incident_response"
)
Rule
HTTP/2 Business-Critical Route Targeting With Source and Error Pattern Correlation
Rule Format
Splunk correlation rule suitable for web logs, proxy logs, CDN logs, WAF logs, load-balancer logs, API-gateway logs, ingress-controller logs, service-mesh telemetry, NDR telemetry, route inventory, source enrichment, TLS or client fingerprint enrichment, application performance telemetry, resource telemetry, change-control records, and SOC triage workflow after business-route validation, source-baseline validation, response-field mapping, timing-window tuning, and environment-specific allowlisting.
Detection Purpose
· Detect HTTP/2 anomaly patterns targeting business-critical routes where source behavior, route sensitivity, response errors, request rejection, and service-impact telemetry indicate resource-exhaustion pressure.
· Identify route-targeted behavior involving source clustering, high request cancellation, high stream reset ratio, repeated protocol errors, header-limit events, frame-limit events, request rejection, or low completed-request ratio.
· Prioritize exposed application paths where degradation creates material business impact, including authentication, APIs, payment workflows, customer portals, SaaS front ends, cloud ingress, Kubernetes ingress, service-mesh ingress, and administrative portals.
· Support escalation when route-targeted HTTP/2 behavior aligns with source context, response errors, resource pressure, application degradation, and absence of approved operational activity.
· Preserve separation between suspicious route targeting and confirmed exploitation by requiring supporting protocol, source, resource, service-impact, change-control, or incident-response evidence before classifying activity as probable exploitation.
· This rule does not prove HTTP/2 exploitation, memory exhaustion, application compromise, credential exposure, lateral movement, or actor attribution without supporting telemetry.
Detection Logic
· Identify HTTP/2 traffic to business-critical routes, listeners, virtual hosts, origins, API paths, ingress paths, service-mesh routes, administrative portals, or high-value application services.
· Prioritize abnormal request cancellation, high stream reset ratio, high incomplete stream ratio, high connection persistence, high request rejection, repeated protocol errors, header-limit events, frame-limit events, or request-to-response imbalance.
· Correlate route-targeted behavior with source clusters, rare autonomous systems, unusual geographies, hosting providers, proxy networks, unusual TLS fingerprints, abnormal client fingerprints, or repeated user-agent patterns.
· Increase confidence when affected routes show elevated 400, 413, 431, 499, 502, 503, 504, upstream timeout, gateway timeout, backend latency, application error increase, or user-facing degradation.
· Increase confidence when route-targeted behavior aligns with memory pressure, CPU pressure, worker exhaustion, queue growth, event-loop delay, target-health degradation, pod restart, container eviction, autoscaling surge, or service degradation.
· Increase confidence when similar activity appears across multiple edge nodes, origins, regions, tenants, routes, or service tiers.
· Reduce severity when route impact aligns with approved load testing, performance testing, synthetic monitoring, resilience testing, vulnerability scanning, deployment activity, failover, partner integration behavior, security testing, or known traffic growth.
· Do not treat route targeting, traffic volume, source novelty, request rejection, response errors, or route latency as HTTP/2 exploitation without supporting protocol, resource, and operational-context evidence.
· Do not use CVE identifiers, proof-of-concept names, source IPs, user agents, or scanner names as the primary detection model.
Required Telemetry
· Splunk index and sourcetype inventory.
· Web-server logs.
· Reverse-proxy logs.
· CDN logs where available.
· WAF logs where available.
· Load-balancer logs.
· API-gateway logs where available.
· Ingress-controller logs where available.
· Service-mesh telemetry where available.
· NDR telemetry where available.
· HTTP protocol version.
· Source IP.
· Source autonomous system where available.
· Source geolocation where available.
· Source network type where available.
· User agent where available.
· TLS fingerprint where available.
· Client fingerprint where available.
· Virtual host.
· Route.
· Listener.
· Origin.
· Business service.
· Tenant where available.
· Request count.
· Connection count.
· Stream count where available.
· Stream reset count where available.
· Request cancellation count where available.
· Completed request count where available.
· Response code.
· Request rejection reason where available.
· Header-limit event where available.
· Frame-limit event where available.
· Protocol-error event where available.
· Request timing.
· Response time.
· Byte count.
· Backend latency.
· Application latency.
· Application error rate.
· Resource telemetry where available.
· Cloud telemetry where available.
· Kubernetes telemetry where available.
· Route criticality inventory.
· Application ownership inventory.
· Approved route baseline.
· Approved testing records.
· Change-control records.
· Incident-response records.
Engineering Implementation Instructions
· Build Splunk macros or lookups for business-critical routes, authentication paths, API routes, payment workflows, customer portals, SaaS front ends, cloud ingress paths, Kubernetes ingress paths, service-mesh ingress paths, administrative portals, and high-value application services.
· Normalize route, virtual host, listener, origin, tenant, source, protocol version, response code, request result, upstream result, and service-impact fields across web, proxy, CDN, WAF, load-balancer, API-gateway, ingress, service-mesh, NDR, resource, cloud, Kubernetes, and application telemetry.
· Build source-context enrichment for repeated source clusters, rare autonomous systems, unusual geographies, hosting providers, proxy networks, unusual TLS fingerprints, abnormal client fingerprints, and repeated user-agent patterns.
· Build route-baseline fields for normal HTTP/2 request volume, connection reuse, stream reset rate, request cancellation rate, request rejection rate, response-code distribution, backend latency, application latency, and transaction-success ratio.
· Build HTTP/2 route-anomaly fields for high stream churn, high stream reset ratio, high request cancellation ratio, high incomplete stream ratio, high connection persistence, repeated protocol errors, repeated header-limit events, repeated frame-limit events, and request-to-response imbalance.
· Build service-impact fields for memory pressure, CPU pressure, worker exhaustion, queue growth, event-loop delay, gateway errors, target-health degradation, backend latency, pod restart, container eviction, autoscaling surge, application error increase, and user-facing degradation.
· Build approved-activity lookups for load testing, performance testing, resilience testing, synthetic monitoring, vulnerability scanning, deployments, failovers, traffic-growth events, partner integrations, security testing, incident response, and approved route changes.
· Use short correlation windows for intense route-targeted anomalies affecting business-critical services.
· Use moderate correlation windows when route-targeted anomalies are lower-rate but align with resource pressure, source clustering, or service-impact telemetry.
· Use longer correlation windows only when repeated route targeting, retained protocol telemetry, incident-response evidence, or application-impact evidence supports delayed linkage.
· Add severity weighting for business-critical route class, authentication impact, API impact, payment workflow impact, customer-facing impact, high reset ratio, low completion ratio, source clustering, resource pressure, service degradation, and absence of approved operational activity.
· Validate index names, sourcetypes, CIM mapping, field extractions, lookups, route baselines, timing windows, exception logic, query performance, and false-positive baselines before production deployment.
· Treat business-critical route degradation as a priority amplifier, not standalone proof of HTTP/2 exploitation.
· Do not enable alert mode until business-route inventory, route baselines, protocol fields, source enrichment, service-impact visibility, exceptions, query performance, and SOC triage workflow are validated.
DRI Assessment
DRI
8.3 / 10
· The rule is behaviorally anchored to durable route-targeted HTTP/2 resource-exhaustion behavior and business-impact correlation rather than static indicators, CVE identifiers, proof-of-concept names, user agents, or source IPs.
· The rule remains useful if an adversary changes source distribution, traffic rate, user agent, request timing, route sequence, stream behavior mix, or HTTP/2 abuse variant.
· The score is supported by the durability of route targeting, source clustering, request cancellation, stream reset behavior, request rejection, protocol errors, traffic imbalance, and route-level impact against business-critical services.
· The score is constrained by legitimate traffic spikes, load testing, synthetic monitoring, vulnerability scanning, security testing, deployments, incomplete route baselines, weak application ownership mapping, and limited HTTP/2 telemetry.
· The rule is durable as a route-impact and resource-exhaustion correlation detector but should not be treated as standalone proof of exploitation or compromise.
TCR Assessment
Operational TCR
7.7 / 10
Full-Telemetry TCR
8.9 / 10
· Operational confidence depends on accurate business-route inventory, HTTP/2 protocol visibility, route baselines, response-code telemetry, source context, resource telemetry, application telemetry, and SIEM correlation quality.
· Operational confidence is reduced where business-route mapping is incomplete, HTTP/2 metadata is unavailable, CDN or WAF logs are sampled, or application telemetry cannot be tied to route-level impact.
· Operational confidence is reduced during load testing, synthetic monitoring, vulnerability scanning, security testing, deployment activity, failover, traffic growth, partner integration changes, or application performance incidents.
· Full-telemetry confidence improves when Splunk correlates route telemetry with CDN logs, WAF logs, proxy logs, load-balancer logs, API-gateway logs, ingress logs, service-mesh telemetry, NDR telemetry, resource telemetry, cloud logs, Kubernetes logs, application performance telemetry, and change-control records.
· Even under full telemetry conditions, this rule should support high-priority investigation and exposure scoping rather than standalone confirmation of exploit success.
Limitations
· Business-critical route degradation can result from normal customer traffic, application regressions, backend dependency failures, deployments, failovers, security testing, or load testing.
· Weak route inventory or application ownership mapping can reduce confidence.
· CDN, WAF, proxy, and load-balancer layers may mask source behavior or normalize route-level anomalies.
· Frame-level HTTP/2 telemetry may be unavailable or retained only briefly.
· The rule may miss attacks that affect low-visibility routes or are absorbed by upstream mitigations.
· The rule may miss low-and-slow behavior that degrades service without breaching route-level thresholds.
· The rule should not be used for actor attribution without incident-specific intelligence, validated behavioral correlation, or confirmed victim-environment evidence.
Detection Query Pattern
Splunk HTTP/2 business-critical route targeting query pattern requiring index validation, sourcetype validation, route inventory validation, source-enrichment validation, HTTP/2 field validation, service-impact validation, route-baseline validation, timing-window tuning, approved operational allowlisting, and false-positive testing before production deployment.
(index IN ($web_indexes$, $proxy_indexes$, $cdn_indexes$, $waf_indexes$, $lb_indexes$, $gateway_indexes$, $ingress_indexes$, $service_mesh_indexes$))
(protocol_version IN ("HTTP/2","h2","h2c") OR http_version IN ("HTTP/2","h2","h2c"))
route IN ($business_critical_routes$)
(
http2_behavior IN (
"high_stream_churn",
"high_stream_reset_ratio",
"high_request_cancellation_ratio",
"high_incomplete_stream_ratio",
"high_connection_persistence",
"request_response_imbalance",
"low_completed_request_ratio",
"repeated_protocol_errors",
"repeated_header_limit_events",
"repeated_frame_limit_events",
"request_rejection_spike"
)
OR response_pattern IN (
"elevated_400",
"elevated_413",
"elevated_431",
"elevated_499",
"elevated_502",
"elevated_503",
"elevated_504",
"upstream_timeout_increase",
"gateway_timeout_increase"
)
)
| eval service_lineage=coalesce(service_lineage, route, virtual_host, listener, origin, dest_service)
| stats count as route_anomaly_count dc(src_ip) as distinct_sources values(src_ip) as src_ip values(user_agent) as user_agent values(http2_behavior) as http2_behavior values(response_pattern) as response_pattern by service_lineage route time span=5m
| lookup sourcecontext_enrichment src_ip OUTPUT source_context autonomous_system source_geolocation tls_fingerprint client_fingerprint
| lookup approved_operational_activity service_lineage route OUTPUT change_context
| join type=left service_lineage [
search index IN ($resource_indexes$, $cloud_indexes$, $kubernetes_indexes$, $application_indexes$)
service_impact_event IN (
"memory_pressure",
"cpu_pressure",
"worker_exhaustion",
"queue_growth",
"event_loop_delay",
"gateway_error_increase",
"target_health_degradation",
"backend_latency_increase",
"pod_restart",
"container_eviction",
"autoscaling_surge",
"application_error_increase",
"user_facing_degradation"
)
| stats count as service_impact_count values(service_impact_event) as service_impact_event by service_lineage time span=5m
]
| where routeanomaly_count >= $route_anomaly_threshold$
| where distinct_sources >= $source_cluster_threshold$ OR service_impact_count >= $service_impact_threshold$
| where isnull(change_context) OR NOT change_context IN (
"approved_load_testing",
"approved_performance_testing",
"approved_resilience_testing",
"approved_synthetic_monitoring",
"approved_vulnerability_scanning",
"approved_partner_integration",
"approved_deployment",
"approved_failover",
"approved_traffic_growth_event",
"approved_security_testing",
"approved_incident_response"
)
Elastic
Detection Viability Assessment
Elastic has three rules for this EXP report.
· Elastic is viable for detecting HTTP/2 header abuse and memory exhaustion across web infrastructure when Elastic can correlate ECS-aligned web, proxy, WAF, CDN, load-balancer, API-gateway, ingress, service-mesh, endpoint, resource, application, Kubernetes, cloud, and operational-context telemetry.
· Elastic is strongest where HTTP and edge-service logs preserve protocol version, source context, route, listener, virtual host, response code, request result, upstream result, request rejection reason, stream reset behavior, request cancellation behavior, header-limit events, frame-limit events, retry expansion, resource pressure, and application-impact context.
· Elastic can support durable detection even when frame-level HTTP/2 telemetry is incomplete, provided detection logic correlates abnormal HTTP/2-facing behavior with source behavior, route sensitivity, resource impact, service degradation, and absence of approved operational activity.
· Elastic is not a standalone source for confirming HTTP/2 CONTINUATION-frame exploitation, Rapid Reset-style exploitation, memory exhaustion, application compromise, host compromise, persistence, lateral movement, or actor attribution unless the underlying telemetry provides sufficient protocol, endpoint, workload, application, cloud, Kubernetes, and incident-response evidence.
· Elastic detections must avoid high-confidence alerting from one HTTP error spike, one stream reset pattern, one request rejection spike, one source cluster, one memory spike, one gateway timeout, one process restart, one pod restart, or one autoscaling event without supporting correlation.
· Elastic rule logic should prioritize multi-signal behavior: HTTP/2 protocol anomaly plus source behavior plus resource pressure plus edge-service or application impact plus operational-context validation.
Rule
HTTP/2 Protocol Anomaly With Resource and Service-Impact Correlation
Rule Format
Elastic correlation rule suitable for ECS-aligned web logs, reverse-proxy logs, CDN logs, WAF logs, load-balancer logs, API-gateway logs, ingress-controller logs, service-mesh telemetry, Elastic Defend telemetry, Elastic Agent telemetry, metricbeat or equivalent resource telemetry, application telemetry, Kubernetes telemetry, cloud telemetry, HTTP/2-enabled route inventory, asset inventory, business-critical route enrichment, change-control enrichment, exception lists, and SOC triage workflow after data-view validation, data-stream validation, ECS field mapping, timing-window tuning, baseline validation, and environment-specific allowlisting.
Detection Purpose
· Detect HTTP/2 protocol anomalies that align with resource pressure or instability on HTTP/2-facing web infrastructure.
· Identify abnormal CONTINUATION-frame behavior, request cancellation, stream reset behavior, high stream churn, header-limit events, frame-limit events, protocol errors, or request rejection patterns when they coincide with memory pressure, worker exhaustion, gateway errors, process instability, pod instability, or application degradation.
· Prioritize exposed web servers, reverse proxies, API gateways, WAF-protected applications, load balancers, CDN origins, Kubernetes ingress controllers, service-mesh ingress gateways, and application front ends.
· Support escalation when protocol anomalies align with source clustering, route sensitivity, resource pressure, service impact, and absence of approved operational activity.
· Preserve separation between suspicious protocol behavior and confirmed exploitation by requiring resource, service-impact, operational-context, or incident-response evidence before classifying activity as probable exploitation.
· This rule does not prove HTTP/2 exploitation, memory exhaustion, application compromise, host compromise, persistence, lateral movement, or actor attribution without supporting telemetry.
Detection Logic
· Identify HTTP/2-facing events from web servers, reverse proxies, CDNs, WAFs, load balancers, API gateways, ingress controllers, service meshes, and application front ends.
· Prioritize events showing CONTINUATION-frame anomalies, HEADERS anomalies, RST_STREAM behavior, high stream churn, request cancellation spikes, incomplete stream ratios, protocol errors, frame-limit events, header-limit events, request rejection spikes, or low completed-request ratios where fields are available.
· Correlate protocol anomalies with resource-impact events involving memory pressure, CPU pressure, worker exhaustion, event-loop delay, queue growth, file-descriptor pressure, process crash, process restart, service restart, container restart, pod eviction, node pressure, or out-of-memory behavior.
· Increase confidence when edge-service errors, upstream timeouts, gateway errors, target-health degradation, origin errors, backend latency, autoscaling surge, application errors, or user-facing degradation occur in the same service lineage.
· Increase confidence when activity affects authentication paths, API routes, payment workflows, customer portals, SaaS front ends, cloud ingress paths, Kubernetes ingress paths, service-mesh ingress paths, or other business-critical services.
· Increase confidence when source clusters, autonomous systems, geographies, TLS fingerprints, client fingerprints, user agents, or proxy paths generate similar HTTP/2 anomaly patterns across multiple routes, regions, tenants, origins, or edge nodes.
· Reduce severity when activity aligns with approved load testing, performance testing, resilience testing, synthetic monitoring, vulnerability scanning, deployment activity, failover, autoscaling, maintenance, security testing, or incident-response activity.
· Do not classify HTTP/2 protocol anomaly, request rejection, stream reset behavior, memory pressure, process instability, or gateway error activity as probable exploitation without multi-signal correlation.
· Do not use source IPs, user agents, proof-of-concept names, scanner names, or CVE identifiers as the primary detection basis.
Required Telemetry
· Elastic data-view and data-stream inventory.
· ECS-aligned web-server logs.
· Reverse-proxy logs.
· CDN logs where available.
· WAF logs where available.
· Load-balancer logs.
· API-gateway logs where available.
· Ingress-controller logs where available.
· Service-mesh telemetry where available.
· Network telemetry where available.
· Elastic Defend telemetry where available.
· Elastic Agent telemetry where available.
· Resource telemetry.
· Kubernetes telemetry where available.
· Cloud telemetry where available.
· Application performance telemetry.
· HTTP protocol version.
· Source IP.
· Source autonomous system where available.
· Source geolocation where available.
· User agent where available.
· TLS fingerprint where available.
· Client fingerprint where available.
· Virtual host.
· Route.
· Listener.
· Origin.
· Destination service.
· Business service.
· Response code.
· Request result.
· Upstream result.
· Request rejection reason where available.
· Header-limit event where available.
· Frame-limit event where available.
· Protocol-error event where available.
· Stream reset count where available.
· Request cancellation count where available.
· Completed request count where available.
· Request count.
· Connection count.
· Response time.
· Request timing.
· Byte count.
· Process restart telemetry where available.
· Container telemetry where available.
· Pod telemetry where available.
· HTTP/2-facing asset inventory.
· Route criticality inventory.
· Change-control records or approved-activity enrichment.
· Approved testing records.
· Incident-response records.
Engineering Implementation Instructions
· Build Elastic data views, enrich policies, exception lists, and detection-rule data sources covering HTTP/2-facing web logs, reverse-proxy logs, CDN logs, WAF logs, load-balancer logs, API-gateway logs, ingress logs, service-mesh telemetry, endpoint telemetry, resource telemetry, Kubernetes telemetry, cloud telemetry, and application telemetry.
· Normalize HTTP and edge-service fields into ECS-aligned fields wherever possible, including protocol version, source address, user agent, URL path, host, route, response code, upstream result, event outcome, service name, and cloud or Kubernetes context.
· Map route, listener, virtual host, origin, destination service, business service, and application ownership into a common service-lineage enrichment model.
· Build protocol-anomaly fields or enrichments for CONTINUATION-frame anomalies, request cancellation, stream reset behavior, high stream churn, incomplete stream ratio, request rejection, header-limit events, frame-limit events, and protocol errors where available.
· Build resource-impact fields for memory pressure, CPU pressure, worker exhaustion, event-loop delay, queue growth, process restart, service restart, container restart, pod eviction, node pressure, out-of-memory behavior, and application degradation.
· Build approved-activity enrichment and exception lists for load testing, performance testing, resilience testing, synthetic monitoring, vulnerability scanning, deployments, failovers, maintenance, security testing, incident response, and autoscaling.
· Use Elastic threshold rules, event correlation rules, EQL sequences, transforms, or precomputed service-lineage enrichments depending on data volume, field availability, and ingestion delay.
· Use short correlation windows when protocol anomalies and resource pressure occur together on the same service lineage.
· Use moderate correlation windows when resource pressure follows lower-rate protocol anomalies.
· Use longer correlation windows only when retained protocol telemetry, incident-response evidence, application-impact telemetry, or workload lineage supports delayed linkage.
· Add severity weighting for business-critical route impact, repeated protocol anomalies, distributed source behavior, memory pressure, worker exhaustion, gateway errors, application degradation, and absence of approved operational activity.
· Validate index names, data streams, ECS mappings, field extractions, enrich policies, exception lists, event timestamps, time-zone handling, ingestion delay, correlation windows, and false-positive baselines before production deployment.
· Treat Elastic correlation output as investigation-ready evidence until local rule performance, field completeness, and SOC triage workflow are validated.
· Do not enable alert mode until data views, data streams, ECS field mappings, enrichments, baselines, exceptions, query performance, and SOC triage workflow are validated.
DRI Assessment
DRI
8.3 / 10
· The rule is behaviorally anchored to durable protocol, resource, service-impact, and operational-context correlation rather than static indicators, CVE identifiers, source IPs, user agents, or proof-of-concept names.
· The rule remains useful if an adversary changes source infrastructure, user agent, request timing, route targeting, traffic distribution, or HTTP/2 abuse variant.
· The score is supported by Elastic’s ability to correlate diverse telemetry across protocol behavior, resource state, application impact, endpoint activity, Kubernetes context, cloud context, and change-control records.
· The score is constrained by field availability, ECS mapping quality, telemetry gaps, incomplete HTTP/2 metadata, CDN or WAF normalization, and incomplete route-to-service lineage.
· The rule is durable as a correlation detector but should not be treated as standalone proof of exploitation without underlying telemetry support.
TCR Assessment
Operational TCR
7.7 / 10
Full-Telemetry TCR
8.9 / 10
· Operational confidence depends on accurate data-view mapping, data-stream mapping, ECS field extraction, route inventory, HTTP/2 protocol visibility, resource telemetry, application telemetry, change-control integration, and correlation quality.
· Operational confidence is reduced where HTTP/2 fields are unavailable, proxy / WAF / CDN logs are sampled, route-to-service lineage is incomplete, or resource telemetry cannot be tied to affected services.
· Operational confidence is reduced during load testing, synthetic monitoring, vulnerability scanning, deployments, failovers, maintenance, autoscaling, security testing, incident response, or legitimate traffic surges.
· Full-telemetry confidence improves when Elastic ingests normalized proxy, CDN, WAF, load-balancer, API-gateway, ingress, service-mesh, endpoint, resource, Kubernetes, cloud, application, and change-control telemetry.
· Even under full telemetry conditions, this rule should support high-confidence escalation only after field validation, timing validation, and false-positive review.
Limitations
· Elastic detection quality depends on underlying telemetry quality, ECS field normalization, data-stream consistency, and retention.
· Many environments do not retain frame-level HTTP/2 telemetry or expose CONTINUATION-frame behavior directly.
· CDN, WAF, load-balancer, or proxy layers may mask source behavior, route context, or origin impact.
· Resource telemetry may show pressure without proving HTTP/2 causality.
· Application degradation may result from backend dependency failures, deployments, failovers, load testing, security testing, or legitimate traffic growth.
· The rule may miss activity if protocol telemetry, resource telemetry, route mapping, or application-impact telemetry is unavailable.
· The rule should not be used for actor attribution without incident-specific intelligence, validated behavioral correlation, or confirmed victim-environment evidence.
Detection Query Pattern
Elastic HTTP/2 protocol anomaly and resource-pressure correlation query pattern requiring index validation, data-stream validation, ECS field mapping validation, route lineage validation, timing-window tuning, approved operational allowlisting, and false-positive testing before production deployment. In production, this pattern may be implemented as an EQL sequence, event correlation rule, threshold rule with enrichments, or transform-backed correlation depending on data volume and field availability.
sequence by service.name with maxspan=10m
[
any where event.dataset in (
"web.access",
"nginx.access",
"apache.access",
"proxy.access",
"cdn.access",
"waf.event",
"loadbalancer.access",
"apigateway.access",
"ingress.access",
"servicemesh.access"
)
and (
network.protocol in ("http2", "h2", "h2c")
or http.version in ("HTTP/2", "h2", "h2c")
)
and (
http2.behavior in (
"continuation_frame_anomaly",
"headers_anomaly",
"rst_stream_behavior",
"high_stream_churn",
"request_cancellation_spike",
"incomplete_stream_ratio",
"protocol_error_spike",
"header_limit_event",
"frame_limit_event",
"request_rejection_spike",
"low_completed_request_ratio"
)
or http.response.status_code in (400, 413, 431, 499, 502, 503, 504)
or event.reason in (
"upstream_timeout_increase",
"gateway_timeout_increase",
"protocol_error_spike",
"header_limit_event",
"frame_limit_event"
)
)
]
[
any where event.dataset in (
"system.metrics",
"elastic_agent.metrics",
"endpoint.events",
"kubernetes.container",
"kubernetes.pod",
"cloud.metrics",
"apm.service"
)
and event.action in (
"memory_pressure",
"cpu_pressure",
"worker_exhaustion",
"event_loop_delay",
"queue_growth",
"process_restart",
"service_restart",
"container_restart",
"pod_eviction",
"node_pressure",
"out_of_memory_behavior",
"application_error_increase",
"user_facing_degradation"
)
]
until [
any where event.dataset in ("change_control", "approved_activity", "case_management")
and change.context in (
"approved_load_testing",
"approved_performance_testing",
"approved_resilience_testing",
"approved_synthetic_monitoring",
"approved_vulnerability_scanning",
"approved_deployment",
"approved_failover",
"approved_autoscaling_event",
"approved_security_testing",
"approved_incident_response"
)
]
Rule
HTTP/2 Edge-to-Application Retry Expansion and Backend Degradation
Rule Format
Elastic correlation rule suitable for ECS-aligned CDN logs, WAF logs, reverse-proxy logs, load-balancer logs, API-gateway logs, ingress-controller logs, service-mesh telemetry, application performance telemetry, resource telemetry, cloud telemetry, Kubernetes telemetry, route inventory, service-lineage enrichment, approved-activity enrichment, exception lists, and SOC triage workflow after route-to-service validation, retry-baseline validation, response-field mapping, timing-window tuning, and environment-specific allowlisting.
Detection Purpose
· Detect edge-to-application retry expansion, timeout growth, target-health degradation, origin withdrawal, backend saturation, or route-level degradation following suspicious HTTP/2-facing activity.
· Identify when HTTP/2 resource-exhaustion pressure propagates from edge services into origins, backend services, Kubernetes services, service-mesh upstreams, application tiers, or business-critical routes.
· Prioritize authentication routes, API routes, payment workflows, customer portals, SaaS front ends, cloud ingress paths, Kubernetes ingress paths, service-mesh ingress paths, and high-value application services.
· Support escalation when retry expansion or route degradation aligns with HTTP/2 anomalies, source clusters, resource pressure, application errors, autoscaling activity, or absence of approved operational activity.
· Preserve separation between service-impact correlation and confirmed exploitation by requiring supporting protocol, source, resource, route, change-control, or incident-response evidence before classifying activity as probable exploitation.
· This rule does not prove HTTP/2 exploitation, memory exhaustion, backend compromise, application compromise, cloud compromise, or actor attribution without supporting telemetry.
Detection Logic
· Identify edge-to-origin or gateway-to-backend communication from CDN, WAF, reverse-proxy, load-balancer, API-gateway, ingress-controller, or service-mesh layers to backend services.
· Prioritize retry expansion, timeout growth, upstream reset increase, connection refusal, backend saturation, request amplification, origin withdrawal, load-balancer target-health degradation, route latency, or application error increase.
· Correlate service-impact patterns with related HTTP/2 anomalies such as request cancellation, stream reset behavior, high stream churn, protocol errors, request rejection, header-limit events, frame-limit events, or low completed-request ratios.
· Increase confidence when route degradation affects business-critical application paths.
· Increase confidence when backend pressure aligns with memory pressure, CPU pressure, worker exhaustion, queue growth, event-loop delay, pod restart, container eviction, node pressure, autoscaling surge, or application degradation.
· Increase confidence when similar route degradation appears across multiple edge nodes, origins, regions, backend services, service tiers, routes, or tenants.
· Reduce severity when activity matches approved load testing, failover, deployment, resilience testing, synthetic monitoring, vulnerability scanning, backend maintenance, CDN change, WAF change, ingress change, service-mesh change, security testing, or incident-response activity.
· Do not classify retry expansion, gateway timeouts, route latency, origin withdrawal, or target-health degradation as HTTP/2 exploitation without supporting HTTP/2 protocol, source, route, resource, or operational-context evidence.
· Do not interpret defensive telemetry export, health-check traffic, autoscaling activity, or mitigation-control activation as adversary-controlled outbound communication without host, process, identity, destination, and incident-response evidence.
Required Telemetry
· Elastic data-view and data-stream inventory.
· CDN logs where available.
· WAF logs where available.
· Reverse-proxy logs.
· Load-balancer logs.
· API-gateway logs where available.
· Ingress-controller logs where available.
· Service-mesh telemetry where available.
· Application performance telemetry.
· Resource telemetry.
· Cloud telemetry where available.
· Kubernetes telemetry where available.
· Edge node.
· Origin.
· Backend service.
· Destination service.
· Route.
· Listener.
· Virtual host.
· Response code.
· Upstream result.
· Connection result.
· Retry count where available.
· Timeout count where available.
· Connection reset count where available.
· Target-health status where available.
· Origin health status where available.
· Request count.
· Byte count.
· Response time.
· Backend latency.
· Application latency.
· Application error rate.
· Autoscaling telemetry where available.
· Route-to-service mapping.
· Business-critical route inventory.
· Origin inventory.
· Backend-service inventory.
· Approved change-control records or approved-activity enrichment.
· Approved testing records.
· Incident-response records.
Engineering Implementation Instructions
· Build Elastic data views, enrich policies, or rule exceptions for edge assets, origins, backend services, business-critical routes, Kubernetes services, service-mesh upstreams, cloud load-balancer targets, and application ownership.
· Normalize edge-to-origin fields across CDN, WAF, reverse-proxy, load-balancer, API-gateway, ingress, service-mesh, cloud, Kubernetes, application, and resource telemetry.
· Map retry, timeout, connection reset, upstream result, target-health, origin-health, route latency, and application-error fields into normalized service-impact fields.
· Build route-to-service lineage that joins virtual host, route, listener, origin, backend service, Kubernetes service, service-mesh upstream, cloud target, tenant, and business application.
· Build HTTP/2 anomaly enrichment for request cancellation, stream reset behavior, protocol errors, request rejection, header-limit events, frame-limit events, high stream churn, and low completed-request ratio.
· Build approved-activity enrichments and exception lists for load testing, performance testing, resilience testing, synthetic monitoring, vulnerability scanning, deployments, failovers, backend maintenance, CDN change, WAF change, ingress change, service-mesh change, security testing, and incident response.
· Use Elastic threshold rules, event correlation rules, EQL sequences, transforms, or precomputed service-lineage enrichments depending on retry telemetry, route-lineage quality, and ingestion delay.
· Use short correlation windows when retry expansion occurs during active HTTP/2 anomaly windows.
· Use moderate correlation windows when retry expansion or target-health degradation follows lower-rate HTTP/2 anomalies.
· Use longer correlation windows only when route-to-service lineage, application-impact telemetry, retained protocol telemetry, or incident-response evidence supports delayed linkage.
· Add severity weighting for business-critical route impact, repeated retry expansion, target-health degradation, origin withdrawal, backend latency, autoscaling surge, resource pressure, and absence of approved operational activity.
· Validate index names, data streams, ECS field mappings, enrichments, service-lineage mapping, event timestamps, ingestion delay, timing windows, exception logic, query performance, and false-positive baselines before production deployment.
· Treat edge-to-application retry expansion as a service-impact amplifier, not standalone proof of HTTP/2 exploitation.
· Do not enable alert mode until route-to-service lineage, retry baselines, target-health visibility, backend service mapping, enrichment availability, exceptions, query performance, and SOC triage workflow are validated.
DRI Assessment
DRI
8.1 / 10
· The rule is behaviorally anchored to durable service-impact propagation from HTTP/2-facing edge infrastructure to origins, backend services, and business-critical routes.
· The rule remains useful if an adversary changes source infrastructure, traffic timing, route selection, user agent, HTTP/2 behavior mix, or attack distribution.
· The score is supported by the durability of retry expansion, timeout growth, target-health degradation, origin withdrawal, backend saturation, route latency, autoscaling surge, and application degradation.
· The score is constrained by CDN abstraction, WAF normalization, weak route-to-service lineage, backend dependency noise, deployment activity, failover activity, security testing, and application-level retry behavior.
· The rule is durable as a service-impact correlation detector but should not be treated as standalone proof of HTTP/2 exploitation.
TCR Assessment
Operational TCR
7.5 / 10
Full-Telemetry TCR
8.8 / 10
· Operational confidence depends on reliable route-to-service mapping, retry telemetry, target-health telemetry, origin inventory, backend-service inventory, application telemetry, resource telemetry, change-control records, and Elastic correlation quality.
· Operational confidence is reduced where CDN, WAF, load-balancer, API-gateway, ingress, or service-mesh telemetry is sampled, incomplete, or disconnected from backend service context.
· Operational confidence is reduced during failovers, deployments, traffic shifting, autoscaling events, resilience testing, load testing, synthetic monitoring, vulnerability scanning, backend maintenance, security testing, or incident response.
· Full-telemetry confidence improves when Elastic correlates edge-to-origin logs with HTTP/2 protocol telemetry, endpoint telemetry, resource telemetry, Kubernetes events, cloud telemetry, application performance telemetry, and change-control records.
· Even under full telemetry conditions, this rule should support service-impact escalation and scoping rather than standalone confirmation of exploitation.
Limitations
· Edge-to-application retry expansion can be caused by backend dependency failures, deployment regressions, autoscaling delays, failovers, security testing, or normal traffic surges.
· CDN, WAF, load-balancer, API-gateway, and service-mesh layers may obscure the original source or normalize route-level behavior.
· Weak route-to-service mapping can reduce confidence in linking edge anomalies to backend impact.
· The rule may miss attacks fully absorbed by CDN or WAF controls before backend impact occurs.
· The rule may miss low-and-slow activity that degrades service without triggering retry or target-health thresholds.
· The rule may generate false positives if retry baselines, backend maintenance records, deployment windows, or failover records are incomplete.
· The rule should not be used for actor attribution without incident-specific intelligence, validated behavioral correlation, or confirmed victim-environment evidence.
Detection Query Pattern
Elastic HTTP/2 edge-to-application retry expansion and backend degradation query pattern requiring index validation, data-stream validation, service-lineage validation, retry-baseline validation, HTTP/2 anomaly enrichment validation, timing-window tuning, approved operational allowlisting, and false-positive testing before production deployment. In production, this pattern may be implemented as an EQL sequence, event correlation rule, threshold rule with enrichments, or transform-backed correlation depending on route-to-service lineage and telemetry volume.
sequence by service.name with maxspan=10m
[
any where event.dataset in (
"cdn.access",
"waf.event",
"proxy.access",
"loadbalancer.access",
"apigateway.access",
"ingress.access",
"servicemesh.access",
"apm.service"
)
and (
event.reason in (
"retry_expansion",
"timeout_growth",
"upstream_reset_increase",
"connection_refusal_increase",
"backend_saturation",
"request_amplification",
"origin_withdrawal",
"target_health_degradation",
"backend_latency_increase",
"route_latency_increase",
"application_error_increase"
)
or http.response.status_code in (502, 503, 504)
)
]
[
any where event.dataset in (
"web.access",
"proxy.access",
"cdn.access",
"waf.event",
"loadbalancer.access",
"apigateway.access",
"ingress.access",
"servicemesh.access"
)
and (
network.protocol in ("http2", "h2", "h2c")
or http.version in ("HTTP/2", "h2", "h2c")
)
and http2.behavior in (
"request_cancellation_spike",
"high_stream_reset_ratio",
"high_stream_churn",
"repeated_protocol_errors",
"request_rejection_spike",
"repeated_header_limit_events",
"repeated_frame_limit_events",
"low_completed_request_ratio"
)
]
until [
any where event.dataset in ("change_control", "approved_activity", "case_management")
and change.context in (
"approved_load_testing",
"approved_performance_testing",
"approved_resilience_testing",
"approved_synthetic_monitoring",
"approved_vulnerability_scanning",
"approved_deployment",
"approved_failover",
"approved_backend_maintenance",
"approved_cdn_change",
"approved_waf_change",
"approved_ingress_change",
"approved_service_mesh_change",
"approved_security_testing",
"approved_incident_response"
)
]
Rule
HTTP/2 Business-Critical Route Targeting With Source and Error Pattern Correlation
Rule Format
Elastic correlation rule suitable for ECS-aligned web logs, proxy logs, CDN logs, WAF logs, load-balancer logs, API-gateway logs, ingress-controller logs, service-mesh telemetry, network telemetry, route inventory, source enrichment, TLS or client fingerprint enrichment, application performance telemetry, resource telemetry, approved-activity enrichment, exception lists, and SOC triage workflow after business-route validation, source-baseline validation, response-field mapping, timing-window tuning, and environment-specific allowlisting.
Detection Purpose
· Detect HTTP/2 anomaly patterns targeting business-critical routes where source behavior, route sensitivity, response errors, request rejection, and service-impact telemetry indicate resource-exhaustion pressure.
· Identify route-targeted behavior involving source clustering, high request cancellation, high stream reset ratio, repeated protocol errors, header-limit events, frame-limit events, request rejection, or low completed-request ratio.
· Prioritize exposed application paths where degradation creates material business impact, including authentication, APIs, payment workflows, customer portals, SaaS front ends, cloud ingress, Kubernetes ingress, service-mesh ingress, and administrative portals.
· Support escalation when route-targeted HTTP/2 behavior aligns with source context, response errors, resource pressure, application degradation, and absence of approved operational activity.
· Preserve separation between suspicious route targeting and confirmed exploitation by requiring supporting protocol, source, resource, service-impact, change-control, or incident-response evidence before classifying activity as probable exploitation.
· This rule does not prove HTTP/2 exploitation, memory exhaustion, application compromise, credential exposure, lateral movement, or actor attribution without supporting telemetry.
Detection Logic
· Identify HTTP/2 traffic to business-critical routes, listeners, virtual hosts, origins, API paths, ingress paths, service-mesh routes, administrative portals, or high-value application services.
· Prioritize abnormal request cancellation, high stream reset ratio, high incomplete stream ratio, high connection persistence, high request rejection, repeated protocol errors, header-limit events, frame-limit events, or request-to-response imbalance.
· Correlate route-targeted behavior with source clusters, rare autonomous systems, unusual geographies, hosting providers, proxy networks, unusual TLS fingerprints, abnormal client fingerprints, or repeated user-agent patterns.
· Increase confidence when affected routes show elevated 400, 413, 431, 499, 502, 503, 504, upstream timeout, gateway timeout, backend latency, application error increase, or user-facing degradation.
· Increase confidence when route-targeted behavior aligns with memory pressure, CPU pressure, worker exhaustion, queue growth, event-loop delay, target-health degradation, pod restart, container eviction, autoscaling surge, or service degradation.
· Increase confidence when similar activity appears across multiple edge nodes, origins, regions, tenants, routes, or service tiers.
· Reduce severity when route impact aligns with approved load testing, performance testing, synthetic monitoring, resilience testing, vulnerability scanning, deployment activity, failover, partner integration behavior, security testing, or known traffic growth.
· Do not treat route targeting, traffic volume, source novelty, request rejection, response errors, or route latency as HTTP/2 exploitation without supporting protocol, resource, and operational-context evidence.
· Do not use CVE identifiers, proof-of-concept names, source IPs, user agents, or scanner names as the primary detection model.
Required Telemetry
· Elastic data-view and data-stream inventory.
· ECS-aligned web-server logs.
· Reverse-proxy logs.
· CDN logs where available.
· WAF logs where available.
· Load-balancer logs.
· API-gateway logs where available.
· Ingress-controller logs where available.
· Service-mesh telemetry where available.
· Network telemetry where available.
· HTTP protocol version.
· Source IP.
· Source autonomous system where available.
· Source geolocation where available.
· Source network type where available.
· User agent where available.
· TLS fingerprint where available.
· Client fingerprint where available.
· Virtual host.
· Route.
· Listener.
· Origin.
· Business service.
· Tenant where available.
· Request count.
· Connection count.
· Stream count where available.
· Stream reset count where available.
· Request cancellation count where available.
· Completed request count where available.
· Response code.
· Request rejection reason where available.
· Header-limit event where available.
· Frame-limit event where available.
· Protocol-error event where available.
· Request timing.
· Response time.
· Byte count.
· Backend latency.
· Application latency.
· Application error rate.
· Resource telemetry where available.
· Cloud telemetry where available.
· Kubernetes telemetry where available.
· Route criticality inventory.
· Application ownership inventory.
· Approved route baseline.
· Approved testing records.
· Change-control records or approved-activity enrichment.
· Incident-response records.
Engineering Implementation Instructions
· Build Elastic data views, enrich policies, exception lists, or detection-rule data sources for business-critical routes, authentication paths, API routes, payment workflows, customer portals, SaaS front ends, cloud ingress paths, Kubernetes ingress paths, service-mesh ingress paths, administrative portals, and high-value application services.
· Normalize route, virtual host, listener, origin, tenant, source, protocol version, response code, request result, upstream result, and service-impact fields across web, proxy, CDN, WAF, load-balancer, API-gateway, ingress, service-mesh, network, resource, cloud, Kubernetes, and application telemetry.
· Build source-context enrichment for repeated source clusters, rare autonomous systems, unusual geographies, hosting providers, proxy networks, unusual TLS fingerprints, abnormal client fingerprints, and repeated user-agent patterns.
· Build route-baseline fields for normal HTTP/2 request volume, connection reuse, stream reset rate, request cancellation rate, request rejection rate, response-code distribution, backend latency, application latency, and transaction-success ratio.
· Build HTTP/2 route-anomaly fields for high stream churn, high stream reset ratio, high request cancellation ratio, high incomplete stream ratio, high connection persistence, repeated protocol errors, repeated header-limit events, repeated frame-limit events, and request-to-response imbalance.
· Build service-impact fields for memory pressure, CPU pressure, worker exhaustion, queue growth, event-loop delay, gateway errors, target-health degradation, backend latency, pod restart, container eviction, autoscaling surge, application error increase, and user-facing degradation.
· Build approved-activity enrichments and exception lists for load testing, performance testing, resilience testing, synthetic monitoring, vulnerability scanning, deployments, failovers, traffic-growth events, partner integrations, security testing, incident response, and approved route changes.
· Use Elastic threshold rules, event correlation rules, EQL sequences, transforms, or precomputed route enrichments depending on business-route inventory quality, source-enrichment availability, and telemetry volume.
· Use short correlation windows for intense route-targeted anomalies affecting business-critical services.
· Use moderate correlation windows when route-targeted anomalies are lower-rate but align with resource pressure, source clustering, or service-impact telemetry.
· Use longer correlation windows only when repeated route targeting, retained protocol telemetry, incident-response evidence, or application-impact evidence supports delayed linkage.
· Add severity weighting for business-critical route class, authentication impact, API impact, payment workflow impact, customer-facing impact, high reset ratio, low completion ratio, source clustering, resource pressure, service degradation, and absence of approved operational activity.
· Validate index names, data streams, ECS mapping, field extractions, enrichments, route baselines, timing windows, exception logic, query performance, and false-positive baselines before production deployment.
· Treat business-critical route degradation as a priority amplifier, not standalone proof of HTTP/2 exploitation.
· Do not enable alert mode until business-route inventory, route baselines, protocol fields, source enrichment, service-impact visibility, exceptions, query performance, and SOC triage workflow are validated.
DRI Assessment
DRI
8.2 / 10
· The rule is behaviorally anchored to durable route-targeted HTTP/2 resource-exhaustion behavior and business-impact correlation rather than static indicators, CVE identifiers, proof-of-concept names, user agents, or source IPs.
· The rule remains useful if an adversary changes source distribution, traffic rate, user agent, request timing, route sequence, stream behavior mix, or HTTP/2 abuse variant.
· The score is supported by the durability of route targeting, source clustering, request cancellation, stream reset behavior, request rejection, protocol errors, traffic imbalance, and route-level impact against business-critical services.
· The score is constrained by legitimate traffic spikes, load testing, synthetic monitoring, vulnerability scanning, security testing, deployments, incomplete route baselines, weak application ownership mapping, and limited HTTP/2 telemetry.
· The rule is durable as a route-impact and resource-exhaustion correlation detector but should not be treated as standalone proof of exploitation or compromise.
TCR Assessment
Operational TCR
7.6 / 10
Full-Telemetry TCR
8.8 / 10
· Operational confidence depends on accurate business-route inventory, HTTP/2 protocol visibility, route baselines, response-code telemetry, source context, resource telemetry, application telemetry, and Elastic correlation quality.
· Operational confidence is reduced where business-route mapping is incomplete, HTTP/2 metadata is unavailable, CDN or WAF logs are sampled, or application telemetry cannot be tied to route-level impact.
· Operational confidence is reduced during load testing, synthetic monitoring, vulnerability scanning, security testing, deployment activity, failover, traffic growth, partner integration changes, or application performance incidents.
· Full-telemetry confidence improves when Elastic correlates route telemetry with CDN logs, WAF logs, proxy logs, load-balancer logs, API-gateway logs, ingress logs, service-mesh telemetry, network telemetry, resource telemetry, cloud logs, Kubernetes logs, application performance telemetry, and change-control records.
· Even under full telemetry conditions, this rule should support high-priority investigation and exposure scoping rather than standalone confirmation of exploit success.
Limitations
· Business-critical route degradation can result from normal customer traffic, application regressions, backend dependency failures, deployments, failovers, security testing, or load testing.
· Weak route inventory or application ownership mapping can reduce confidence.
· CDN, WAF, proxy, and load-balancer layers may mask source behavior or normalize route-level anomalies.
· Frame-level HTTP/2 telemetry may be unavailable or retained only briefly.
· The rule may miss attacks that affect low-visibility routes or are absorbed by upstream mitigations.
· The rule may miss low-and-slow behavior that degrades service without breaching route-level thresholds.
· The rule should not be used for actor attribution without incident-specific intelligence, validated behavioral correlation, or confirmed victim-environment evidence.
Detection Query Pattern
Elastic HTTP/2 business-critical route targeting query pattern requiring index validation, data-stream validation, route inventory validation, source-enrichment validation, HTTP/2 field validation, service-impact validation, route-baseline validation, timing-window tuning, approved operational allowlisting, and false-positive testing before production deployment. In production, this pattern may be implemented as an EQL sequence, event correlation rule, threshold rule with route and source enrichments, or transform-backed correlation depending on business-route inventory quality and telemetry volume.
sequence by url.path with maxspan=10m
[
any where event.dataset in (
"web.access",
"nginx.access",
"apache.access",
"proxy.access",
"cdn.access",
"waf.event",
"loadbalancer.access",
"apigateway.access",
"ingress.access",
"servicemesh.access"
)
and (
network.protocol in ("http2", "h2", "h2c")
or http.version in ("HTTP/2", "h2", "h2c")
)
and url.path in ("$business_critical_routes$")
and (
http2.behavior in (
"high_stream_churn",
"high_stream_reset_ratio",
"high_request_cancellation_ratio",
"high_incomplete_stream_ratio",
"high_connection_persistence",
"request_response_imbalance",
"low_completed_request_ratio",
"repeated_protocol_errors",
"repeated_header_limit_events",
"repeated_frame_limit_events",
"request_rejection_spike"
)
or http.response.status_code in (400, 413, 431, 499, 502, 503, 504)
)
]
[
any where event.dataset in (
"system.metrics",
"elastic_agent.metrics",
"kubernetes.container",
"kubernetes.pod",
"cloud.metrics",
"apm.service"
)
and event.action in (
"memory_pressure",
"cpu_pressure",
"worker_exhaustion",
"queue_growth",
"event_loop_delay",
"gateway_error_increase",
"target_health_degradation",
"backend_latency_increase",
"pod_restart",
"container_eviction",
"autoscaling_surge",
"application_error_increase",
"user_facing_degradation"
)
]
until [
any where event.dataset in ("change_control", "approved_activity", "case_management")
and change.context in (
"approved_load_testing",
"approved_performance_testing",
"approved_resilience_testing",
"approved_synthetic_monitoring",
"approved_vulnerability_scanning",
"approved_partner_integration",
"approved_deployment",
"approved_failover",
"approved_traffic_growth_event",
"approved_security_testing",
"approved_incident_response"
)
]
QRadar
Detection Viability Assessment
QRadar has three rules for this EXP report.
· QRadar is viable for detecting HTTP/2 header abuse and memory exhaustion across web infrastructure when QRadar can correlate web, proxy, WAF, CDN, load-balancer, API-gateway, ingress, service-mesh, network, endpoint, resource, application, Kubernetes, cloud, and approved-activity telemetry through normalized events, DSM parsing, custom properties, reference sets, building blocks, offense rules, and correlation windows.
· QRadar is strongest where HTTP/2-facing events expose protocol version, source context, route, listener, virtual host, response code, request result, upstream result, request rejection reason, stream reset behavior, request cancellation behavior, header-limit events, frame-limit events, retry expansion, resource pressure, application-impact context, and approved operational context.
· QRadar can support durable detection even when frame-level HTTP/2 telemetry is incomplete, provided rule logic correlates abnormal HTTP/2-facing behavior with source behavior, route sensitivity, resource impact, service degradation, and absence of approved operational activity.
· QRadar is not a standalone source for confirming HTTP/2 CONTINUATION-frame exploitation, Rapid Reset-style exploitation, memory exhaustion, application compromise, host compromise, persistence, lateral movement, or actor attribution unless the underlying telemetry provides sufficient protocol, network, endpoint, resource, application, cloud, Kubernetes, and incident-response evidence.
· QRadar detections must avoid high-confidence alerting from one HTTP error spike, one stream reset pattern, one request rejection spike, one source cluster, one memory spike, one gateway timeout, one process restart, one pod restart, or one autoscaling event without supporting correlation.
· QRadar rule logic should prioritize multi-signal behavior: HTTP/2 protocol anomaly plus source behavior plus resource pressure plus edge-service or application impact plus approved-activity validation.
Rule
HTTP/2 Protocol Anomaly With Resource and Service-Impact Correlation
Rule Format
QRadar correlation rule suitable for normalized web logs, reverse-proxy logs, CDN logs, WAF logs, load-balancer logs, API-gateway logs, ingress-controller logs, service-mesh telemetry, network telemetry, endpoint telemetry, resource telemetry, application telemetry, Kubernetes telemetry, cloud telemetry, HTTP/2-enabled route inventory, asset inventory, business-critical route reference sets, approved-activity reference sets, custom properties, building blocks, offense routing, and SOC triage workflow after log-source validation, DSM validation, custom-property validation, reference-set validation, timing-window tuning, baseline validation, and environment-specific allowlisting.
Detection Purpose
· Detect HTTP/2 protocol anomalies that align with resource pressure or instability on HTTP/2-facing web infrastructure.
· Identify abnormal CONTINUATION-frame behavior, request cancellation, stream reset behavior, high stream churn, header-limit events, frame-limit events, protocol errors, or request rejection patterns when they coincide with memory pressure, worker exhaustion, gateway errors, process instability, pod instability, or application degradation.
· Prioritize exposed web servers, reverse proxies, API gateways, WAF-protected applications, load balancers, CDN origins, Kubernetes ingress controllers, service-mesh ingress gateways, and application front ends.
· Support escalation when protocol anomalies align with source clustering, route sensitivity, resource pressure, service impact, and absence of approved operational activity.
· Preserve separation between suspicious protocol behavior and confirmed exploitation by requiring resource, service-impact, approved-activity, or incident-response evidence before classifying activity as probable exploitation.
· This rule does not prove HTTP/2 exploitation, memory exhaustion, application compromise, host compromise, persistence, lateral movement, or actor attribution without supporting telemetry.
Detection Logic
· Identify HTTP/2-facing events from web servers, reverse proxies, CDNs, WAFs, load balancers, API gateways, ingress controllers, service meshes, and application front ends.
· Prioritize events showing CONTINUATION-frame anomalies, HEADERS anomalies, RST_STREAM behavior, high stream churn, request cancellation spikes, incomplete stream ratios, protocol errors, frame-limit events, header-limit events, request rejection spikes, or low completed-request ratios where custom properties are available.
· Correlate protocol anomalies with resource-impact events involving memory pressure, CPU pressure, worker exhaustion, event-loop delay, queue growth, file-descriptor pressure, process crash, process restart, service restart, container restart, pod eviction, node pressure, or out-of-memory behavior.
· Increase confidence when edge-service errors, upstream timeouts, gateway errors, target-health degradation, origin errors, backend latency, autoscaling surge, application errors, or user-facing degradation occur in the same service lineage.
· Increase confidence when activity affects authentication paths, API routes, payment workflows, customer portals, SaaS front ends, cloud ingress paths, Kubernetes ingress paths, service-mesh ingress paths, or other business-critical services.
· Increase confidence when source clusters, autonomous systems, geographies, TLS fingerprints, client fingerprints, user agents, or proxy paths generate similar HTTP/2 anomaly patterns across multiple routes, regions, tenants, origins, or edge nodes.
· Reduce severity when activity aligns with approved load testing, performance testing, resilience testing, synthetic monitoring, vulnerability scanning, deployment activity, failover, autoscaling, maintenance, security testing, or incident-response activity.
· Do not classify HTTP/2 protocol anomaly, request rejection, stream reset behavior, memory pressure, process instability, or gateway error activity as probable exploitation without multi-signal correlation.
· Do not use source IPs, user agents, proof-of-concept names, scanner names, or CVE identifiers as the primary detection basis.
Required Telemetry
· QRadar log-source inventory.
· QRadar DSM inventory.
· Custom-property inventory.
· Web-server logs.
· Reverse-proxy logs.
· CDN logs where available.
· WAF logs where available.
· Load-balancer logs.
· API-gateway logs where available.
· Ingress-controller logs where available.
· Service-mesh telemetry where available.
· Network telemetry where available.
· Endpoint telemetry where available.
· Resource telemetry.
· Kubernetes telemetry where available.
· Cloud telemetry where available.
· Application performance telemetry.
· HTTP protocol version.
· Source IP.
· Source autonomous system where available.
· Source geolocation where available.
· User agent where available.
· TLS fingerprint where available.
· Client fingerprint where available.
· Virtual host.
· Route.
· Listener.
· Origin.
· Destination service.
· Business service.
· Response code.
· Request result.
· Upstream result.
· Request rejection reason where available.
· Header-limit event where available.
· Frame-limit event where available.
· Protocol-error event where available.
· Stream reset count where available.
· Request cancellation count where available.
· Completed request count where available.
· Request count.
· Connection count.
· Response time.
· Request timing.
· Byte count.
· Process restart telemetry where available.
· Container telemetry where available.
· Pod telemetry where available.
· HTTP/2-facing asset inventory.
· Route criticality reference set.
· Approved-activity reference set.
· Change-control records or approved-activity records.
· Approved testing records.
· Incident-response records.
Engineering Implementation Instructions
· Build QRadar log-source groups covering HTTP/2-facing web logs, reverse-proxy logs, CDN logs, WAF logs, load-balancer logs, API-gateway logs, ingress logs, service-mesh telemetry, endpoint telemetry, resource telemetry, Kubernetes telemetry, cloud telemetry, and application telemetry.
· Build QRadar reference sets for HTTP/2-facing assets, business-critical routes, exposed application front ends, sensitive services, approved scanners, approved synthetic monitoring, approved load testing, approved deployment windows, approved failover windows, approved security testing, approved incident-response activity, and approved autoscaling events.
· Normalize HTTP and edge-service fields through DSM parsing or custom properties, including protocol version, source address, user agent, URL path, host, route, response code, upstream result, event outcome, service name, cloud context, and Kubernetes context.
· Map route, listener, virtual host, origin, destination service, business service, and application ownership into a common service-lineage reference model.
· Build protocol-anomaly custom properties or event categories for CONTINUATION-frame anomalies, request cancellation, stream reset behavior, high stream churn, incomplete stream ratio, request rejection, header-limit events, frame-limit events, and protocol errors where available.
· Build resource-impact custom properties or event categories for memory pressure, CPU pressure, worker exhaustion, event-loop delay, queue growth, process restart, service restart, container restart, pod eviction, node pressure, out-of-memory behavior, and application degradation.
· Build approved-activity reference sets for load testing, performance testing, resilience testing, synthetic monitoring, vulnerability scanning, deployments, failovers, maintenance, security testing, incident response, and autoscaling.
· Use QRadar building blocks to separate protocol anomaly, source behavior, resource impact, route sensitivity, and approved-activity suppression before combining them into a correlation rule.
· Use short correlation windows when protocol anomalies and resource pressure occur together on the same service lineage.
· Use moderate correlation windows when resource pressure follows lower-rate protocol anomalies.
· Use longer correlation windows only when retained protocol telemetry, incident-response evidence, application-impact telemetry, or workload lineage supports delayed linkage.
· Add severity weighting for business-critical route impact, repeated protocol anomalies, distributed source behavior, memory pressure, worker exhaustion, gateway errors, application degradation, and absence of approved operational activity.
· Validate log sources, DSM parsing, custom properties, reference sets, building blocks, event timestamps, time-zone handling, ingestion delay, correlation windows, offense grouping, rule responses, and false-positive baselines before production deployment.
· Treat QRadar correlation output as investigation-ready evidence until local rule performance, field completeness, offense tuning, and SOC triage workflow are validated.
· Do not enable alert mode until log sources, DSMs, custom properties, reference sets, baselines, exceptions, correlation performance, offense routing, and SOC triage workflow are validated.
DRI Assessment
DRI
8.2 / 10
· The rule is behaviorally anchored to durable protocol, resource, service-impact, and approved-activity correlation rather than static indicators, CVE identifiers, source IPs, user agents, or proof-of-concept names.
· The rule remains useful if an adversary changes source infrastructure, user agent, request timing, route targeting, traffic distribution, or HTTP/2 abuse variant.
· The score is supported by QRadar’s ability to correlate diverse telemetry across protocol behavior, resource state, application impact, endpoint activity, Kubernetes context, cloud context, and approved-activity records.
· The score is constrained by field availability, DSM parsing quality, custom-property quality, telemetry gaps, incomplete HTTP/2 metadata, CDN or WAF normalization, and incomplete route-to-service lineage.
· The rule is durable as a correlation detector but should not be treated as standalone proof of exploitation without underlying telemetry support.
TCR Assessment
Operational TCR
7.6 / 10
Full-Telemetry TCR
8.8 / 10
· Operational confidence depends on accurate log-source mapping, DSM parsing, custom-property extraction, route inventory, HTTP/2 protocol visibility, resource telemetry, application telemetry, approved-activity integration, and QRadar correlation quality.
· Operational confidence is reduced where HTTP/2 fields are unavailable, proxy / WAF / CDN logs are sampled, route-to-service lineage is incomplete, or resource telemetry cannot be tied to affected services.
· Operational confidence is reduced during load testing, synthetic monitoring, vulnerability scanning, deployments, failovers, maintenance, autoscaling, security testing, incident response, or legitimate traffic surges.
· Full-telemetry confidence improves when QRadar ingests normalized proxy, CDN, WAF, load-balancer, API-gateway, ingress, service-mesh, endpoint, resource, Kubernetes, cloud, application, and approved-activity telemetry.
· Even under full telemetry conditions, this rule should support high-confidence escalation only after field validation, timing validation, offense tuning, and false-positive review.
Limitations
· QRadar detection quality depends on underlying telemetry quality, DSM parsing, custom-property extraction, log-source consistency, and retention.
· Many environments do not retain frame-level HTTP/2 telemetry or expose CONTINUATION-frame behavior directly.
· CDN, WAF, load-balancer, or proxy layers may mask source behavior, route context, or origin impact.
· Resource telemetry may show pressure without proving HTTP/2 causality.
· Application degradation may result from backend dependency failures, deployments, failovers, load testing, security testing, or legitimate traffic growth.
· The rule may miss activity if protocol telemetry, resource telemetry, route mapping, or application-impact telemetry is unavailable.
· The rule should not be used for actor attribution without incident-specific intelligence, validated behavioral correlation, or confirmed victim-environment evidence.
Detection Query Pattern
QRadar HTTP/2 protocol anomaly and resource-pressure correlation query pattern requiring log-source validation, DSM validation, custom-property validation, service-lineage validation, timing-window tuning, approved operational allowlisting, and false-positive testing before production deployment. In production, this pattern should be implemented through QRadar building blocks, reference sets, custom properties, offense tuning, and correlation rules rather than treated as direct copy/paste AQL.
SELECT
"Service Lineage",
"Route",
"Virtual Host",
"Source IP",
COUNT(*) AS "HTTP2 Anomaly Count"
FROM events
WHERE
(
"Protocol Version" IN ('HTTP/2', 'h2', 'h2c')
OR "HTTP Version" IN ('HTTP/2', 'h2', 'h2c')
)
AND (
"HTTP2 Behavior" IN (
'continuation_frame_anomaly',
'headers_anomaly',
'rst_stream_behavior',
'high_stream_churn',
'request_cancellation_spike',
'incomplete_stream_ratio',
'protocol_error_spike',
'header_limit_event',
'frame_limit_event',
'request_rejection_spike',
'low_completed_request_ratio'
)
OR "HTTP Response Code" IN (400, 413, 431, 499, 502, 503, 504)
OR "Event Reason" IN (
'upstream_timeout_increase',
'gateway_timeout_increase',
'protocol_error_spike',
'header_limit_event',
'frame_limit_event'
)
)
AND "Destination Asset" IN REFERENCESET('HTTP2_Facing_Assets')
AND "Route" NOT IN REFERENCESET('Approved_Testing_Routes')
GROUP BY
"Service Lineage",
"Route",
"Virtual Host",
"Source IP"
HAVING
"HTTP2 Anomaly Count" >= $HTTP2_ANOMALY_THRESHOLD$
Correlate the resulting building block within the approved timing window against resource-impact events where the same service lineage or destination asset shows memory pressure, worker exhaustion, process restart, container restart, pod eviction, node pressure, out-of-memory behavior, application error increase, or user-facing degradation, excluding events that match approved operational activity reference sets.
Rule
HTTP/2 Edge-to-Application Retry Expansion and Backend Degradation
Rule Format
QRadar correlation rule suitable for normalized CDN logs, WAF logs, reverse-proxy logs, load-balancer logs, API-gateway logs, ingress-controller logs, service-mesh telemetry, application performance telemetry, resource telemetry, cloud telemetry, Kubernetes telemetry, route inventory, service-lineage reference sets, approved-activity reference sets, custom properties, building blocks, offense routing, and SOC triage workflow after route-to-service validation, retry-baseline validation, response-field mapping, timing-window tuning, and environment-specific allowlisting.
Detection Purpose
· Detect edge-to-application retry expansion, timeout growth, target-health degradation, origin withdrawal, backend saturation, or route-level degradation following suspicious HTTP/2-facing activity.
· Identify when HTTP/2 resource-exhaustion pressure propagates from edge services into origins, backend services, Kubernetes services, service-mesh upstreams, application tiers, or business-critical routes.
· Prioritize authentication routes, API routes, payment workflows, customer portals, SaaS front ends, cloud ingress paths, Kubernetes ingress paths, service-mesh ingress paths, and high-value application services.
· Support escalation when retry expansion or route degradation aligns with HTTP/2 anomalies, source clusters, resource pressure, application errors, autoscaling activity, or absence of approved operational activity.
· Preserve separation between service-impact correlation and confirmed exploitation by requiring supporting protocol, source, resource, route, change-control, or incident-response evidence before classifying activity as probable exploitation.
· This rule does not prove HTTP/2 exploitation, memory exhaustion, backend compromise, application compromise, cloud compromise, or actor attribution without supporting telemetry.
Detection Logic
· Identify edge-to-origin or gateway-to-backend communication from CDN, WAF, reverse-proxy, load-balancer, API-gateway, ingress-controller, or service-mesh layers to backend services.
· Prioritize retry expansion, timeout growth, upstream reset increase, connection refusal, backend saturation, request amplification, origin withdrawal, load-balancer target-health degradation, route latency, or application error increase.
· Correlate service-impact patterns with related HTTP/2 anomalies such as request cancellation, stream reset behavior, high stream churn, protocol errors, request rejection, header-limit events, frame-limit events, or low completed-request ratios.
· Increase confidence when route degradation affects business-critical application paths.
· Increase confidence when backend pressure aligns with memory pressure, CPU pressure, worker exhaustion, queue growth, event-loop delay, pod restart, container eviction, node pressure, autoscaling surge, or application degradation.
· Increase confidence when similar route degradation appears across multiple edge nodes, origins, regions, backend services, service tiers, routes, or tenants.
· Reduce severity when activity matches approved load testing, failover, deployment, resilience testing, synthetic monitoring, vulnerability scanning, backend maintenance, CDN change, WAF change, ingress change, service-mesh change, security testing, or incident-response activity.
· Do not classify retry expansion, gateway timeouts, route latency, origin withdrawal, or target-health degradation as HTTP/2 exploitation without supporting HTTP/2 protocol, source, route, resource, or operational-context evidence.
· Do not interpret defensive telemetry export, health-check traffic, autoscaling activity, or mitigation-control activation as adversary-controlled outbound communication without host, process, identity, destination, and incident-response evidence.
Required Telemetry
· QRadar log-source inventory.
· QRadar DSM inventory.
· Custom-property inventory.
· CDN logs where available.
· WAF logs where available.
· Reverse-proxy logs.
· Load-balancer logs.
· API-gateway logs where available.
· Ingress-controller logs where available.
· Service-mesh telemetry where available.
· Application performance telemetry.
· Resource telemetry.
· Cloud telemetry where available.
· Kubernetes telemetry where available.
· Edge node.
· Origin.
· Backend service.
· Destination service.
· Route.
· Listener.
· Virtual host.
· Response code.
· Upstream result.
· Connection result.
· Retry count where available.
· Timeout count where available.
· Connection reset count where available.
· Target-health status where available.
· Origin health status where available.
· Request count.
· Byte count.
· Response time.
· Backend latency.
· Application latency.
· Application error rate.
· Autoscaling telemetry where available.
· Route-to-service mapping.
· Business-critical route reference set.
· Origin inventory.
· Backend-service inventory.
· Approved change-control records or approved-activity records.
· Approved testing records.
· Incident-response records.
Engineering Implementation Instructions
· Build QRadar log-source groups, reference sets, custom properties, and building blocks for edge assets, origins, backend services, business-critical routes, Kubernetes services, service-mesh upstreams, cloud load-balancer targets, and application ownership.
· Normalize edge-to-origin fields across CDN, WAF, reverse-proxy, load-balancer, API-gateway, ingress, service-mesh, cloud, Kubernetes, application, and resource telemetry.
· Map retry, timeout, connection reset, upstream result, target-health, origin-health, route latency, and application-error fields into normalized service-impact custom properties.
· Build route-to-service lineage through reference sets or custom properties that join virtual host, route, listener, origin, backend service, Kubernetes service, service-mesh upstream, cloud target, tenant, and business application.
· Build HTTP/2 anomaly building blocks for request cancellation, stream reset behavior, protocol errors, request rejection, header-limit events, frame-limit events, high stream churn, and low completed-request ratio.
· Build approved-activity reference sets for load testing, performance testing, resilience testing, synthetic monitoring, vulnerability scanning, deployments, failovers, backend maintenance, CDN change, WAF change, ingress change, service-mesh change, security testing, and incident response.
· Use QRadar building blocks to separate retry expansion, backend degradation, HTTP/2 anomaly enrichment, route sensitivity, and approved-activity suppression before combining them into a correlation rule.
· Use short correlation windows when retry expansion occurs during active HTTP/2 anomaly windows.
· Use moderate correlation windows when retry expansion or target-health degradation follows lower-rate HTTP/2 anomalies.
· Use longer correlation windows only when route-to-service lineage, application-impact telemetry, retained protocol telemetry, or incident-response evidence supports delayed linkage.
· Add severity weighting for business-critical route impact, repeated retry expansion, target-health degradation, origin withdrawal, backend latency, autoscaling surge, resource pressure, and absence of approved operational activity.
· Validate log sources, DSM parsing, custom properties, reference sets, service-lineage mapping, event timestamps, ingestion delay, timing windows, exception logic, correlation performance, offense routing, and false-positive baselines before production deployment.
· Treat edge-to-application retry expansion as a service-impact amplifier, not standalone proof of HTTP/2 exploitation.
· Do not enable alert mode until route-to-service lineage, retry baselines, target-health visibility, backend service mapping, reference sets, custom properties, offense tuning, correlation performance, and SOC triage workflow are validated.
DRI Assessment
DRI
8.0 / 10
· The rule is behaviorally anchored to durable service-impact propagation from HTTP/2-facing edge infrastructure to origins, backend services, and business-critical routes.
· The rule remains useful if an adversary changes source infrastructure, traffic timing, route selection, user agent, HTTP/2 behavior mix, or attack distribution.
· The score is supported by the durability of retry expansion, timeout growth, target-health degradation, origin withdrawal, backend saturation, route latency, autoscaling surge, and application degradation.
· The score is constrained by CDN abstraction, WAF normalization, weak route-to-service lineage, backend dependency noise, deployment activity, failover activity, security testing, and application-level retry behavior.
· The rule is durable as a service-impact correlation detector but should not be treated as standalone proof of HTTP/2 exploitation.
TCR Assessment
Operational TCR
7.4 / 10
Full-Telemetry TCR
8.7 / 10
· Operational confidence depends on reliable route-to-service mapping, retry telemetry, target-health telemetry, origin inventory, backend-service inventory, application telemetry, resource telemetry, approved-activity records, and QRadar correlation quality.
· Operational confidence is reduced where CDN, WAF, load-balancer, API-gateway, ingress, or service-mesh telemetry is sampled, incomplete, or disconnected from backend service context.
· Operational confidence is reduced during failovers, deployments, traffic shifting, autoscaling events, resilience testing, load testing, synthetic monitoring, vulnerability scanning, backend maintenance, security testing, or incident response.
· Full-telemetry confidence improves when QRadar correlates edge-to-origin logs with HTTP/2 protocol telemetry, endpoint telemetry, resource telemetry, Kubernetes events, cloud telemetry, application performance telemetry, and approved-activity records.
· Even under full telemetry conditions, this rule should support service-impact escalation and scoping rather than standalone confirmation of exploitation.
Limitations
· Edge-to-application retry expansion can be caused by backend dependency failures, deployment regressions, autoscaling delays, failovers, security testing, or normal traffic surges.
· CDN, WAF, load-balancer, API-gateway, and service-mesh layers may obscure the original source or normalize route-level behavior.
· Weak route-to-service mapping can reduce confidence in linking edge anomalies to backend impact.
· The rule may miss attacks fully absorbed by CDN or WAF controls before backend impact occurs.
· The rule may miss low-and-slow activity that degrades service without triggering retry or target-health thresholds.
· The rule may generate false positives if retry baselines, backend maintenance records, deployment windows, or failover records are incomplete.
· The rule should not be used for actor attribution without incident-specific intelligence, validated behavioral correlation, or confirmed victim-environment evidence.
Detection Query Pattern
QRadar HTTP/2 edge-to-application retry expansion and backend degradation query pattern requiring log-source validation, DSM validation, service-lineage validation, retry-baseline validation, HTTP/2 anomaly enrichment validation, timing-window tuning, approved operational allowlisting, and false-positive testing before production deployment. In production, this pattern should be implemented through QRadar building blocks, reference sets, custom properties, offense tuning, and correlation rules rather than treated as direct copy/paste AQL.
SELECT
"Service Lineage",
"Route",
"Origin",
"Backend Service",
COUNT(*) AS "Service Impact Count"
FROM events
WHERE
(
"Service Impact Pattern" IN (
'retry_expansion',
'timeout_growth',
'upstream_reset_increase',
'connection_refusal_increase',
'backend_saturation',
'request_amplification',
'origin_withdrawal',
'target_health_degradation',
'backend_latency_increase',
'route_latency_increase',
'application_error_increase'
)
OR "HTTP Response Code" IN (502, 503, 504)
OR "Event Reason" IN (
'upstream_timeout_increase',
'gateway_timeout_increase',
'origin_error_increase',
'target_unhealthy'
)
)
AND "Source Asset" IN REFERENCESET('HTTP2_Edge_Assets')
AND "Destination Asset" IN REFERENCESET('HTTP2_Backend_Services')
GROUP BY
"Service Lineage",
"Route",
"Origin",
"Backend Service"
HAVING
"Service Impact Count" >= $SERVICE_IMPACT_THRESHOLD$
Correlate the resulting building block within the approved timing window against HTTP/2 anomaly events for the same service lineage, route, origin, or backend service, excluding events that match approved operational activity reference sets.
Rule
HTTP/2 Business-Critical Route Targeting With Source and Error Pattern Correlation
Rule Format
QRadar correlation rule suitable for normalized web logs, proxy logs, CDN logs, WAF logs, load-balancer logs, API-gateway logs, ingress-controller logs, service-mesh telemetry, network telemetry, route inventory, source enrichment, TLS or client fingerprint enrichment, application performance telemetry, resource telemetry, approved-activity reference sets, custom properties, building blocks, offense routing, and SOC triage workflow after business-route validation, source-baseline validation, response-field mapping, timing-window tuning, and environment-specific allowlisting.
Detection Purpose
· Detect HTTP/2 anomaly patterns targeting business-critical routes where source behavior, route sensitivity, response errors, request rejection, and service-impact telemetry indicate resource-exhaustion pressure.
· Identify route-targeted behavior involving source clustering, high request cancellation, high stream reset ratio, repeated protocol errors, header-limit events, frame-limit events, request rejection, or low completed-request ratio.
· Prioritize exposed application paths where degradation creates material business impact, including authentication, APIs, payment workflows, customer portals, SaaS front ends, cloud ingress, Kubernetes ingress, service-mesh ingress, and administrative portals.
· Support escalation when route-targeted HTTP/2 behavior aligns with source context, response errors, resource pressure, application degradation, and absence of approved operational activity.
· Preserve separation between suspicious route targeting and confirmed exploitation by requiring supporting protocol, source, resource, service-impact, approved-activity, or incident-response evidence before classifying activity as probable exploitation.
· This rule does not prove HTTP/2 exploitation, memory exhaustion, application compromise, credential exposure, lateral movement, or actor attribution without supporting telemetry.
Detection Logic
· Identify HTTP/2 traffic to business-critical routes, listeners, virtual hosts, origins, API paths, ingress paths, service-mesh routes, administrative portals, or high-value application services.
· Prioritize abnormal request cancellation, high stream reset ratio, high incomplete stream ratio, high connection persistence, high request rejection, repeated protocol errors, header-limit events, frame-limit events, or request-to-response imbalance.
· Correlate route-targeted behavior with source clusters, rare autonomous systems, unusual geographies, hosting providers, proxy networks, unusual TLS fingerprints, abnormal client fingerprints, or repeated user-agent patterns.
· Increase confidence when affected routes show elevated 400, 413, 431, 499, 502, 503, 504, upstream timeout, gateway timeout, backend latency, application error increase, or user-facing degradation.
· Increase confidence when route-targeted behavior aligns with memory pressure, CPU pressure, worker exhaustion, queue growth, event-loop delay, target-health degradation, pod restart, container eviction, autoscaling surge, or service degradation.
· Increase confidence when similar activity appears across multiple edge nodes, origins, regions, tenants, routes, or service tiers.
· Reduce severity when route impact aligns with approved load testing, performance testing, synthetic monitoring, resilience testing, vulnerability scanning, deployment activity, failover, partner integration behavior, security testing, or known traffic growth.
· Do not treat route targeting, traffic volume, source novelty, request rejection, response errors, or route latency as HTTP/2 exploitation without supporting protocol, resource, and operational-context evidence.
· Do not use CVE identifiers, proof-of-concept names, source IPs, user agents, or scanner names as the primary detection model.
Required Telemetry
· QRadar log-source inventory.
· QRadar DSM inventory.
· Custom-property inventory.
· Web-server logs.
· Reverse-proxy logs.
· CDN logs where available.
· WAF logs where available.
· Load-balancer logs.
· API-gateway logs where available.
· Ingress-controller logs where available.
· Service-mesh telemetry where available.
· Network telemetry where available.
· HTTP protocol version.
· Source IP.
· Source autonomous system where available.
· Source geolocation where available.
· Source network type where available.
· User agent where available.
· TLS fingerprint where available.
· Client fingerprint where available.
· Virtual host.
· Route.
· Listener.
· Origin.
· Business service.
· Tenant where available.
· Request count.
· Connection count.
· Stream count where available.
· Stream reset count where available.
· Request cancellation count where available.
· Completed request count where available.
· Response code.
· Request rejection reason where available.
· Header-limit event where available.
· Frame-limit event where available.
· Protocol-error event where available.
· Request timing.
· Response time.
· Byte count.
· Backend latency.
· Application latency.
· Application error rate.
· Resource telemetry where available.
· Cloud telemetry where available.
· Kubernetes telemetry where available.
· Route criticality reference set.
· Application ownership inventory.
· Approved route baseline.
· Approved testing records.
· Change-control records or approved-activity reference set.
· Incident-response records.
Engineering Implementation Instructions
· Build QRadar log-source groups, reference sets, custom properties, and building blocks for business-critical routes, authentication paths, API routes, payment workflows, customer portals, SaaS front ends, cloud ingress paths, Kubernetes ingress paths, service-mesh ingress paths, administrative portals, and high-value application services.
· Normalize route, virtual host, listener, origin, tenant, source, protocol version, response code, request result, upstream result, and service-impact fields across web, proxy, CDN, WAF, load-balancer, API-gateway, ingress, service-mesh, network, resource, cloud, Kubernetes, and application telemetry.
· Build source-context reference sets or custom properties for repeated source clusters, rare autonomous systems, unusual geographies, hosting providers, proxy networks, unusual TLS fingerprints, abnormal client fingerprints, and repeated user-agent patterns.
· Build route-baseline custom properties or reference data for normal HTTP/2 request volume, connection reuse, stream reset rate, request cancellation rate, request rejection rate, response-code distribution, backend latency, application latency, and transaction-success ratio.
· Build HTTP/2 route-anomaly building blocks for high stream churn, high stream reset ratio, high request cancellation ratio, high incomplete stream ratio, high connection persistence, repeated protocol errors, repeated header-limit events, repeated frame-limit events, and request-to-response imbalance.
· Build service-impact building blocks for memory pressure, CPU pressure, worker exhaustion, queue growth, event-loop delay, gateway errors, target-health degradation, backend latency, pod restart, container eviction, autoscaling surge, application error increase, and user-facing degradation.
· Build approved-activity reference sets for load testing, performance testing, resilience testing, synthetic monitoring, vulnerability scanning, deployments, failovers, traffic-growth events, partner integrations, security testing, incident response, and approved route changes.
· Use QRadar building blocks to separate business-route targeting, source context, error pattern correlation, service impact, and approved-activity suppression before combining them into a correlation rule.
· Use short correlation windows for intense route-targeted anomalies affecting business-critical services.
· Use moderate correlation windows when route-targeted anomalies are lower-rate but align with resource pressure, source clustering, or service-impact telemetry.
· Use longer correlation windows only when repeated route targeting, retained protocol telemetry, incident-response evidence, or application-impact evidence supports delayed linkage.
· Add severity weighting for business-critical route class, authentication impact, API impact, payment workflow impact, customer-facing impact, high reset ratio, low completion ratio, source clustering, resource pressure, service degradation, and absence of approved operational activity.
· Validate log sources, DSM parsing, custom properties, reference sets, route baselines, timing windows, exception logic, correlation performance, offense routing, and false-positive baselines before production deployment.
· Treat business-critical route degradation as a priority amplifier, not standalone proof of HTTP/2 exploitation.
· Do not enable alert mode until business-route inventory, route baselines, protocol fields, source enrichment, service-impact visibility, reference sets, custom properties, offense tuning, correlation performance, and SOC triage workflow are validated.
DRI Assessment
DRI
8.1 / 10
· The rule is behaviorally anchored to durable route-targeted HTTP/2 resource-exhaustion behavior and business-impact correlation rather than static indicators, CVE identifiers, proof-of-concept names, user agents, or source IPs.
· The rule remains useful if an adversary changes source distribution, traffic rate, user agent, request timing, route sequence, stream behavior mix, or HTTP/2 abuse variant.
· The score is supported by the durability of route targeting, source clustering, request cancellation, stream reset behavior, request rejection, protocol errors, traffic imbalance, and route-level impact against business-critical services.
· The score is constrained by legitimate traffic spikes, load testing, synthetic monitoring, vulnerability scanning, security testing, deployments, incomplete route baselines, weak application ownership mapping, and limited HTTP/2 telemetry.
· The rule is durable as a route-impact and resource-exhaustion correlation detector but should not be treated as standalone proof of exploitation or compromise.
TCR Assessment
Operational TCR
7.5 / 10
Full-Telemetry TCR
8.7 / 10
· Operational confidence depends on accurate business-route inventory, HTTP/2 protocol visibility, route baselines, response-code telemetry, source context, resource telemetry, application telemetry, and QRadar correlation quality.
· Operational confidence is reduced where business-route mapping is incomplete, HTTP/2 metadata is unavailable, CDN or WAF logs are sampled, or application telemetry cannot be tied to route-level impact.
· Operational confidence is reduced during load testing, synthetic monitoring, vulnerability scanning, security testing, deployment activity, failover, traffic growth, partner integration changes, or application performance incidents.
· Full-telemetry confidence improves when QRadar correlates route telemetry with CDN logs, WAF logs, proxy logs, load-balancer logs, API-gateway logs, ingress logs, service-mesh telemetry, network telemetry, resource telemetry, cloud logs, Kubernetes logs, application performance telemetry, and approved-activity records.
· Even under full telemetry conditions, this rule should support high-priority investigation and exposure scoping rather than standalone confirmation of exploit success.
Limitations
· Business-critical route degradation can result from normal customer traffic, application regressions, backend dependency failures, deployments, failovers, security testing, or load testing.
· Weak route inventory or application ownership mapping can reduce confidence.
· CDN, WAF, proxy, and load-balancer layers may mask source behavior or normalize route-level anomalies.
· Frame-level HTTP/2 telemetry may be unavailable or retained only briefly.
· The rule may miss attacks that affect low-visibility routes or are absorbed by upstream mitigations.
· The rule may miss low-and-slow behavior that degrades service without breaching route-level thresholds.
· The rule should not be used for actor attribution without incident-specific intelligence, validated behavioral correlation, or confirmed victim-environment evidence.
Detection Query Pattern
QRadar HTTP/2 business-critical route targeting query pattern requiring log-source validation, DSM validation, route inventory validation, source-enrichment validation, HTTP/2 field validation, service-impact validation, route-baseline validation, timing-window tuning, approved operational allowlisting, and false-positive testing before production deployment. In production, this pattern should be implemented through QRadar building blocks, reference sets, custom properties, offense tuning, and correlation rules rather than treated as direct copy/paste AQL.
SELECT
"Service Lineage",
"Route",
"Source IP",
"User Agent",
COUNT(*) AS "Route Anomaly Count",
COUNT(DISTINCT "Source IP") AS "Distinct Source Count"
FROM events
WHERE
(
"Protocol Version" IN ('HTTP/2', 'h2', 'h2c')
OR "HTTP Version" IN ('HTTP/2', 'h2', 'h2c')
)
AND "Route" IN REFERENCESET('Business_Critical_HTTP2_Routes')
AND (
"HTTP2 Behavior" IN (
'high_stream_churn',
'high_stream_reset_ratio',
'high_request_cancellation_ratio',
'high_incomplete_stream_ratio',
'high_connection_persistence',
'request_response_imbalance',
'low_completed_request_ratio',
'repeated_protocol_errors',
'repeated_header_limit_events',
'repeated_frame_limit_events',
'request_rejection_spike'
)
OR "HTTP Response Code" IN (400, 413, 431, 499, 502, 503, 504)
)
GROUP BY
"Service Lineage",
"Route",
"Source IP",
"User Agent"
HAVING
"Route Anomaly Count" >= $ROUTE_ANOMALY_THRESHOLD$
Correlate the resulting building block within the approved timing window against source-context reference sets and service-impact building blocks, excluding events that match approved operational activity reference sets.
SIGMA
Detection Viability Assessment
SIGMA has three rules for this EXP report.
· SIGMA is viable for portable detection logic where HTTP/2-facing web, proxy, WAF, CDN, load-balancer, API-gateway, ingress, service-mesh, endpoint, resource, application, Kubernetes, cloud, and approved-activity telemetry can be normalized into SIEM-compatible fields.
· SIGMA is strongest as a cross-platform detection specification for HTTP/2 anomaly correlation, edge-to-application service degradation, and business-critical route targeting where downstream SIEMs can map required fields into Splunk, Elastic, QRadar, Sentinel, Chronicle, or another supported detection platform.
· SIGMA is not a native protocol sensor and cannot independently confirm HTTP/2 CONTINUATION-frame exploitation, Rapid Reset-style exploitation, memory exhaustion, application compromise, host compromise, persistence, lateral movement, credential theft, or actor attribution.
· SIGMA rules for this report should be treated as portable detection patterns that require local field mapping, telemetry validation, enrichment, exception handling, performance testing, and SIEM-specific conversion before alert deployment.
· SIGMA detections must avoid high-confidence alerting from one HTTP error spike, one stream reset pattern, one request rejection spike, one source cluster, one memory spike, one gateway timeout, one process restart, one pod restart, or one autoscaling event without supporting correlation.
· SIGMA rule logic should prioritize multi-signal behavior: HTTP/2 protocol anomaly plus source behavior plus resource pressure plus edge-service or application impact plus approved-activity validation.
Rule
HTTP/2 Protocol Anomaly With Resource and Service-Impact Correlation
Rule Format
SIGMA portable correlation rule suitable for SIEM environments that can normalize web logs, reverse-proxy logs, CDN logs, WAF logs, load-balancer logs, API-gateway logs, ingress-controller logs, service-mesh telemetry, endpoint telemetry, resource telemetry, application telemetry, Kubernetes telemetry, cloud telemetry, HTTP/2-enabled asset inventory, route inventory, business-critical route enrichment, approved-activity enrichment, and SOC triage workflow after target-platform field mapping, backend conversion, timing-window tuning, baseline validation, and environment-specific allowlisting.
Detection Purpose
· Detect HTTP/2 protocol anomalies that align with resource pressure or instability on HTTP/2-facing web infrastructure.
· Identify abnormal CONTINUATION-frame behavior, request cancellation, stream reset behavior, high stream churn, header-limit events, frame-limit events, protocol errors, or request rejection patterns when they coincide with memory pressure, worker exhaustion, gateway errors, process instability, pod instability, or application degradation.
· Prioritize exposed web servers, reverse proxies, API gateways, WAF-protected applications, load balancers, CDN origins, Kubernetes ingress controllers, service-mesh ingress gateways, and application front ends.
· Support escalation when protocol anomalies align with source clustering, route sensitivity, resource pressure, service impact, and absence of approved operational activity.
· Preserve separation between suspicious protocol behavior and confirmed exploitation by requiring resource, service-impact, approved-activity, or incident-response evidence before classifying activity as probable exploitation.
· This rule does not prove HTTP/2 exploitation, memory exhaustion, application compromise, host compromise, persistence, lateral movement, credential exposure, or actor attribution without supporting telemetry.
Detection Logic
· Identify HTTP/2-facing events from web servers, reverse proxies, CDNs, WAFs, load balancers, API gateways, ingress controllers, service meshes, and application front ends.
· Prioritize events showing CONTINUATION-frame anomalies, HEADERS anomalies, RST_STREAM behavior, high stream churn, request cancellation spikes, incomplete stream ratios, protocol errors, frame-limit events, header-limit events, request rejection spikes, or low completed-request ratios where fields are available.
· Correlate protocol anomalies with resource-impact events involving memory pressure, CPU pressure, worker exhaustion, event-loop delay, queue growth, file-descriptor pressure, process crash, process restart, service restart, container restart, pod eviction, node pressure, or out-of-memory behavior.
· Increase confidence when edge-service errors, upstream timeouts, gateway errors, target-health degradation, origin errors, backend latency, autoscaling surge, application errors, or user-facing degradation occur in the same service lineage.
· Increase confidence when activity affects authentication paths, API routes, payment workflows, customer portals, SaaS front ends, cloud ingress paths, Kubernetes ingress paths, service-mesh ingress paths, or other business-critical services.
· Increase confidence when source clusters, autonomous systems, geographies, TLS fingerprints, client fingerprints, user agents, or proxy paths generate similar HTTP/2 anomaly patterns across multiple routes, regions, tenants, origins, or edge nodes.
· Reduce severity when activity aligns with approved load testing, performance testing, resilience testing, synthetic monitoring, vulnerability scanning, deployment activity, failover, autoscaling, maintenance, security testing, or incident-response activity.
· Do not classify HTTP/2 protocol anomaly, request rejection, stream reset behavior, memory pressure, process instability, or gateway error activity as probable exploitation without multi-signal correlation.
· Do not use source IPs, user agents, proof-of-concept names, scanner names, or CVE identifiers as the primary detection basis.
Required Telemetry
· SIEM log-source inventory.
· SIGMA target-backend mapping.
· Web-server logs.
· Reverse-proxy logs.
· CDN logs where available.
· WAF logs where available.
· Load-balancer logs.
· API-gateway logs where available.
· Ingress-controller logs where available.
· Service-mesh telemetry where available.
· Endpoint telemetry where available.
· Resource telemetry.
· Kubernetes telemetry where available.
· Cloud telemetry where available.
· Application performance telemetry.
· HTTP protocol version.
· Source IP.
· Source autonomous system where available.
· Source geolocation where available.
· User agent where available.
· TLS fingerprint where available.
· Client fingerprint where available.
· Virtual host.
· Route.
· Listener.
· Origin.
· Destination service.
· Business service.
· Response code.
· Request result.
· Upstream result.
· Request rejection reason where available.
· Header-limit event where available.
· Frame-limit event where available.
· Protocol-error event where available.
· Stream reset count where available.
· Request cancellation count where available.
· Completed request count where available.
· Request count.
· Connection count.
· Response time.
· Request timing.
· Byte count.
· Process restart telemetry where available.
· Container telemetry where available.
· Pod telemetry where available.
· HTTP/2-facing asset inventory.
· Route criticality inventory.
· Approved-activity enrichment.
· Change-control records.
· Approved testing records.
· Incident-response records.
Engineering Implementation Instructions
· Convert this SIGMA rule only after the target SIEM backend, field schema, log sources, telemetry coverage, correlation support, and enrichment availability are validated.
· Build field mappings for HTTP protocol version, URL path, route, virtual host, listener, origin, destination service, response code, upstream result, event outcome, source IP, user agent, TLS fingerprint, client fingerprint, service name, Kubernetes context, cloud context, and application context.
· Build portable protocol-anomaly selections for CONTINUATION-frame anomalies, request cancellation, stream reset behavior, high stream churn, incomplete stream ratio, request rejection, header-limit events, frame-limit events, and protocol errors where available.
· Build resource-impact selections for memory pressure, CPU pressure, worker exhaustion, event-loop delay, queue growth, process restart, service restart, container restart, pod eviction, node pressure, out-of-memory behavior, and application degradation.
· Build enrichment mappings for HTTP/2-facing assets, business-critical routes, exposed application front ends, approved scanners, approved synthetic monitoring, approved load testing, approved deployment windows, approved failover windows, approved security testing, approved incident-response activity, and approved autoscaling events.
· Use target-platform correlation features to join protocol anomaly, resource impact, route sensitivity, source behavior, and approved-activity suppression.
· Use short correlation windows when protocol anomalies and resource pressure occur together on the same service lineage.
· Use moderate correlation windows when resource pressure follows lower-rate protocol anomalies.
· Use longer correlation windows only when retained protocol telemetry, incident-response evidence, application-impact telemetry, or workload lineage supports delayed linkage.
· Add severity weighting in the target SIEM for business-critical route impact, repeated protocol anomalies, distributed source behavior, memory pressure, worker exhaustion, gateway errors, application degradation, and absence of approved operational activity.
· Validate converted query syntax, backend field names, parser behavior, event timestamps, time-zone handling, ingestion delay, enrichment joins, exception logic, correlation windows, query performance, and false-positive baselines before production deployment.
· Treat SIGMA output as a portable implementation pattern until converted and validated in the target environment.
· Do not enable alert mode until local telemetry, backend conversion, field mapping, enrichment, baselines, exceptions, query performance, and SOC triage workflow are validated.
DRI Assessment
DRI
8.0 / 10
· The rule is behaviorally anchored to durable protocol, resource, service-impact, and approved-activity correlation rather than static indicators, CVE identifiers, source IPs, user agents, or proof-of-concept names.
· The rule remains useful if an adversary changes source infrastructure, user agent, request timing, route targeting, traffic distribution, or HTTP/2 abuse variant.
· The score is supported by the portability of the behavioral model across SIEM platforms that can normalize HTTP/2-facing telemetry and resource-impact data.
· The score is constrained by SIGMA’s dependence on target-platform field mapping, parser quality, correlation support, enrichment availability, and telemetry completeness.
· The rule is durable as a portable correlation pattern but should not be treated as standalone proof of exploitation without target-environment validation.
TCR Assessment
Operational TCR
7.1 / 10
Full-Telemetry TCR
8.5 / 10
· Operational confidence depends on accurate backend conversion, field extraction, route inventory, HTTP/2 protocol visibility, resource telemetry, application telemetry, approved-activity integration, and target-SIEM correlation quality.
· Operational confidence is reduced where HTTP/2 fields are unavailable, proxy / WAF / CDN logs are sampled, route-to-service lineage is incomplete, or the target backend cannot support multi-stage correlation.
· Operational confidence is reduced during load testing, synthetic monitoring, vulnerability scanning, deployments, failovers, maintenance, autoscaling, security testing, incident response, or legitimate traffic surges.
· Full-telemetry confidence improves when the target SIEM correlates normalized proxy, CDN, WAF, load-balancer, API-gateway, ingress, service-mesh, endpoint, resource, Kubernetes, cloud, application, and approved-activity telemetry.
· Even under full telemetry conditions, this rule should support high-confidence escalation only after backend conversion, field validation, timing validation, and false-positive review.
Limitations
· SIGMA is a portable rule format and does not guarantee field availability, parser behavior, correlation support, or performance in the target SIEM.
· Many environments do not retain frame-level HTTP/2 telemetry or expose CONTINUATION-frame behavior directly.
· CDN, WAF, load-balancer, or proxy layers may mask source behavior, route context, or origin impact.
· Resource telemetry may show pressure without proving HTTP/2 causality.
· Application degradation may result from backend dependency failures, deployments, failovers, load testing, security testing, or legitimate traffic growth.
· The rule may miss activity if protocol telemetry, resource telemetry, route mapping, or application-impact telemetry is unavailable.
· The rule should not be used for actor attribution without incident-specific intelligence, validated behavioral correlation, or confirmed victim-environment evidence.
Detection Query Pattern
SIGMA HTTP/2 protocol anomaly and resource-pressure correlation pattern requiring backend conversion, field mapping, telemetry validation, service-lineage validation, timing-window tuning, approved operational allowlisting, and false-positive testing before production deployment. This pattern should be implemented as a target-SIEM correlation rule. The YAML below represents the portable event-selection component only and must be correlated with resource-impact telemetry in the target platform.
title: HTTP2 Protocol Anomaly With Resource And Service Impact Correlation
id: cyberdax-http2-protocol-resource-impact-correlation
status: experimental
description: Detects HTTP/2 protocol anomaly patterns that require correlation with resource pressure or service degradation on HTTP/2-facing infrastructure.
logsource:
category: webserver
detection:
selection_http2:
http.version:
- HTTP/2
- h2
- h2c
selection_http2_behavior:
http2.behavior:
- continuation_frame_anomaly
- headers_anomaly
- rst_stream_behavior
- high_stream_churn
- request_cancellation_spike
- incomplete_stream_ratio
- protocol_error_spike
- header_limit_event
- frame_limit_event
- request_rejection_spike
- low_completed_request_ratio
selection_http_errors:
http.response.status_code:
- 400
- 413
- 431
- 499
- 502
- 503
- 504
condition: selection_http2 and (selection_http2_behavior or selection_http_errors)
fields:
· source.ip
· user_agent.original
· http.version
· http.response.status_code
· url.path
· event.reason
falsepositives:
· Approved load testing.
· Approved performance testing.
· Approved resilience testing.
· Approved synthetic monitoring.
· Approved vulnerability scanning.
· Approved deployment activity.
· Approved failover activity.
· Approved autoscaling activity.
· Approved security testing.
· Approved incident response.
level: medium
Correlate this event-selection component in the target SIEM with resource-impact telemetry for the same service lineage, host, route, origin, workload, or application, including memory pressure, worker exhaustion, process restart, service restart, container restart, pod eviction, node pressure, out-of-memory behavior, application error increase, or user-facing degradation. Promote severity only when supporting resource-impact evidence exists and approved operational activity is excluded.
Rule
HTTP/2 Edge-to-Application Retry Expansion and Backend Degradation
Rule Format
SIGMA portable correlation rule suitable for SIEM environments that can normalize CDN logs, WAF logs, reverse-proxy logs, load-balancer logs, API-gateway logs, ingress-controller logs, service-mesh telemetry, application performance telemetry, resource telemetry, cloud telemetry, Kubernetes telemetry, route inventory, service-lineage enrichment, approved-activity enrichment, and SOC triage workflow after target-platform field mapping, route-to-service validation, retry-baseline validation, timing-window tuning, backend conversion, and environment-specific allowlisting.
Detection Purpose
· Detect edge-to-application retry expansion, timeout growth, target-health degradation, origin withdrawal, backend saturation, or route-level degradation following suspicious HTTP/2-facing activity.
· Identify when HTTP/2 resource-exhaustion pressure propagates from edge services into origins, backend services, Kubernetes services, service-mesh upstreams, application tiers, or business-critical routes.
· Prioritize authentication routes, API routes, payment workflows, customer portals, SaaS front ends, cloud ingress paths, Kubernetes ingress paths, service-mesh ingress paths, and high-value application services.
· Support escalation when retry expansion or route degradation aligns with HTTP/2 anomalies, source clusters, resource pressure, application errors, autoscaling activity, or absence of approved operational activity.
· Preserve separation between service-impact correlation and confirmed exploitation by requiring supporting protocol, source, resource, route, approved-activity, or incident-response evidence before classifying activity as probable exploitation.
· This rule does not prove HTTP/2 exploitation, memory exhaustion, backend compromise, application compromise, cloud compromise, or actor attribution without supporting telemetry.
Detection Logic
· Identify edge-to-origin or gateway-to-backend communication from CDN, WAF, reverse-proxy, load-balancer, API-gateway, ingress-controller, or service-mesh layers to backend services.
· Prioritize retry expansion, timeout growth, upstream reset increase, connection refusal, backend saturation, request amplification, origin withdrawal, load-balancer target-health degradation, route latency, or application error increase.
· Correlate service-impact patterns with related HTTP/2 anomalies such as request cancellation, stream reset behavior, high stream churn, protocol errors, request rejection, header-limit events, frame-limit events, or low completed-request ratios.
· Increase confidence when route degradation affects business-critical application paths.
· Increase confidence when backend pressure aligns with memory pressure, CPU pressure, worker exhaustion, queue growth, event-loop delay, pod restart, container eviction, node pressure, autoscaling surge, or application degradation.
· Increase confidence when similar route degradation appears across multiple edge nodes, origins, regions, backend services, service tiers, routes, or tenants.
· Reduce severity when activity matches approved load testing, failover, deployment, resilience testing, synthetic monitoring, vulnerability scanning, backend maintenance, CDN change, WAF change, ingress change, service-mesh change, security testing, or incident-response activity.
· Do not classify retry expansion, gateway timeouts, route latency, origin withdrawal, or target-health degradation as HTTP/2 exploitation without supporting HTTP/2 protocol, source, route, resource, or operational-context evidence.
· Do not interpret defensive telemetry export, health-check traffic, autoscaling activity, or mitigation-control activation as adversary-controlled outbound communication without host, process, identity, destination, and incident-response evidence.
Required Telemetry
· SIEM log-source inventory.
· SIGMA target-backend mapping.
· CDN logs where available.
· WAF logs where available.
· Reverse-proxy logs.
· Load-balancer logs.
· API-gateway logs where available.
· Ingress-controller logs where available.
· Service-mesh telemetry where available.
· Application performance telemetry.
· Resource telemetry.
· Cloud telemetry where available.
· Kubernetes telemetry where available.
· Edge node.
· Origin.
· Backend service.
· Destination service.
· Route.
· Listener.
· Virtual host.
· Response code.
· Upstream result.
· Connection result.
· Retry count where available.
· Timeout count where available.
· Connection reset count where available.
· Target-health status where available.
· Origin health status where available.
· Request count.
· Byte count.
· Response time.
· Backend latency.
· Application latency.
· Application error rate.
· Autoscaling telemetry where available.
· Route-to-service mapping.
· Business-critical route inventory.
· Origin inventory.
· Backend-service inventory.
· Approved change-control records or approved-activity enrichment.
· Approved testing records.
· Incident-response records.
Engineering Implementation Instructions
· Convert this SIGMA rule only after the target SIEM backend, field schema, log sources, route-to-service lineage, retry telemetry, correlation support, and enrichment availability are validated.
· Build field mappings for edge asset, origin, backend service, route, listener, virtual host, destination service, response code, upstream result, retry count, timeout count, target-health status, origin-health status, backend latency, application latency, and application error rate.
· Build portable service-impact selections for retry expansion, timeout growth, upstream reset increase, connection refusal, backend saturation, request amplification, origin withdrawal, target-health degradation, backend latency increase, route latency increase, and application error increase.
· Build HTTP/2 anomaly enrichment for request cancellation, stream reset behavior, protocol errors, request rejection, header-limit events, frame-limit events, high stream churn, and low completed-request ratio.
· Build approved-activity enrichment for load testing, performance testing, resilience testing, synthetic monitoring, vulnerability scanning, deployments, failovers, backend maintenance, CDN change, WAF change, ingress change, service-mesh change, security testing, and incident response.
· Use target-platform correlation features to join retry expansion, backend degradation, HTTP/2 anomaly enrichment, route sensitivity, resource impact, and approved-activity suppression.
· Use short correlation windows when retry expansion occurs during active HTTP/2 anomaly windows.
· Use moderate correlation windows when retry expansion or target-health degradation follows lower-rate HTTP/2 anomalies.
· Use longer correlation windows only when route-to-service lineage, application-impact telemetry, retained protocol telemetry, or incident-response evidence supports delayed linkage.
· Add severity weighting in the target SIEM for business-critical route impact, repeated retry expansion, target-health degradation, origin withdrawal, backend latency, autoscaling surge, resource pressure, and absence of approved operational activity.
· Validate converted query syntax, backend field names, parser behavior, event timestamps, time-zone handling, ingestion delay, enrichment joins, exception logic, correlation windows, query performance, and false-positive baselines before production deployment.
· Treat edge-to-application retry expansion as a service-impact amplifier, not standalone proof of HTTP/2 exploitation.
· Do not enable alert mode until local telemetry, backend conversion, field mapping, route-to-service lineage, retry baselines, enrichment, exceptions, query performance, and SOC triage workflow are validated.
DRI Assessment
DRI
7.9 / 10
· The rule is behaviorally anchored to durable service-impact propagation from HTTP/2-facing edge infrastructure to origins, backend services, and business-critical routes.
· The rule remains useful if an adversary changes source infrastructure, traffic timing, route selection, user agent, HTTP/2 behavior mix, or attack distribution.
· The score is supported by the durability of retry expansion, timeout growth, target-health degradation, origin withdrawal, backend saturation, route latency, autoscaling surge, and application degradation.
· The score is constrained by SIGMA’s dependence on target-platform field mapping, backend support for multi-stage correlation, route-to-service lineage, retry telemetry quality, and enrichment availability.
· The rule is durable as a portable service-impact correlation pattern but should not be treated as standalone proof of HTTP/2 exploitation.
TCR Assessment
Operational TCR
7.0 / 10
Full-Telemetry TCR
8.4 / 10
· Operational confidence depends on reliable backend conversion, route-to-service mapping, retry telemetry, target-health telemetry, origin inventory, backend-service inventory, application telemetry, resource telemetry, approved-activity records, and target-SIEM correlation quality.
· Operational confidence is reduced where CDN, WAF, load-balancer, API-gateway, ingress, or service-mesh telemetry is sampled, incomplete, or disconnected from backend service context.
· Operational confidence is reduced during failovers, deployments, traffic shifting, autoscaling events, resilience testing, load testing, synthetic monitoring, vulnerability scanning, backend maintenance, security testing, or incident response.
· Full-telemetry confidence improves when the target SIEM correlates edge-to-origin logs with HTTP/2 protocol telemetry, endpoint telemetry, resource telemetry, Kubernetes events, cloud telemetry, application performance telemetry, and approved-activity records.
· Even under full telemetry conditions, this rule should support service-impact escalation and scoping rather than standalone confirmation of exploitation.
Limitations
· SIGMA does not guarantee support for multi-stage correlation in every target SIEM backend.
· Edge-to-application retry expansion can be caused by backend dependency failures, deployment regressions, autoscaling delays, failovers, security testing, or normal traffic surges.
· CDN, WAF, load-balancer, API-gateway, and service-mesh layers may obscure the original source or normalize route-level behavior.
· Weak route-to-service mapping can reduce confidence in linking edge anomalies to backend impact.
· The rule may miss attacks fully absorbed by CDN or WAF controls before backend impact occurs.
· The rule may miss low-and-slow activity that degrades service without triggering retry or target-health thresholds.
· The rule should not be used for actor attribution without incident-specific intelligence, validated behavioral correlation, or confirmed victim-environment evidence.
Detection Query Pattern
SIGMA HTTP/2 edge-to-application retry expansion and backend degradation correlation pattern requiring backend conversion, field mapping, route-to-service validation, retry-baseline validation, HTTP/2 anomaly enrichment validation, timing-window tuning, approved operational allowlisting, and false-positive testing before production deployment. This pattern should be implemented as a target-SIEM correlation rule. The YAML below represents the portable service-impact event-selection component only and must be correlated with HTTP/2 anomaly evidence in the target platform.
title: HTTP2 Edge To Application Retry Expansion And Backend Degradation
id: cyberdax-http2-edge-application-retry-backend-degradation
status: experimental
description: Detects retry expansion, timeout growth, backend degradation, or route-level service impact that requires correlation with suspicious HTTP/2-facing activity.
logsource:
category: proxy
detection:
selection_service_impact:
event.reason:
- retry_expansion
- timeout_growth
- upstream_reset_increase
- connection_refusal_increase
- backend_saturation
- request_amplification
- origin_withdrawal
- target_health_degradation
- backend_latency_increase
- route_latency_increase
- application_error_increase
selection_gateway_errors:
http.response.status_code:
- 502
- 503
- 504
condition: selection_service_impact or selection_gateway_errors
fields:
· source.ip
· destination.ip
· url.path
· http.response.status_code
· event.reason
· cloud.region
· kubernetes.namespace
falsepositives:
· Approved load testing.
· Approved performance testing.
· Approved resilience testing.
· Approved synthetic monitoring.
· Approved vulnerability scanning.
· Approved deployment activity.
· Approved failover activity.
· Approved backend maintenance.
· Approved CDN change.
· Approved WAF change.
· Approved ingress change.
· Approved service-mesh change.
· Approved security testing.
· Approved incident response.
level: medium
Correlate this event-selection component in the target SIEM with HTTP/2 anomaly events for the same service lineage, route, origin, or backend service, including request cancellation, stream reset behavior, high stream churn, protocol errors, request rejection, header-limit events, frame-limit events, or low completed-request ratio. Promote severity only when related HTTP/2 anomaly evidence exists and approved operational activity is excluded.
Rule
HTTP/2 Business-Critical Route Targeting With Source and Error Pattern Correlation
Rule Format
SIGMA portable correlation rule suitable for SIEM environments that can normalize web logs, proxy logs, CDN logs, WAF logs, load-balancer logs, API-gateway logs, ingress-controller logs, service-mesh telemetry, network telemetry, route inventory, source enrichment, TLS or client fingerprint enrichment, application performance telemetry, resource telemetry, approved-activity enrichment, and SOC triage workflow after target-platform field mapping, business-route validation, source-baseline validation, timing-window tuning, backend conversion, and environment-specific allowlisting.
Detection Purpose
· Detect HTTP/2 anomaly patterns targeting business-critical routes where source behavior, route sensitivity, response errors, request rejection, and service-impact telemetry indicate resource-exhaustion pressure.
· Identify route-targeted behavior involving source clustering, high request cancellation, high stream reset ratio, repeated protocol errors, header-limit events, frame-limit events, request rejection, or low completed-request ratio.
· Prioritize exposed application paths where degradation creates material business impact, including authentication, APIs, payment workflows, customer portals, SaaS front ends, cloud ingress, Kubernetes ingress, service-mesh ingress, and administrative portals.
· Support escalation when route-targeted HTTP/2 behavior aligns with source context, response errors, resource pressure, application degradation, and absence of approved operational activity.
· Preserve separation between suspicious route targeting and confirmed exploitation by requiring supporting protocol, source, resource, service-impact, approved-activity, or incident-response evidence before classifying activity as probable exploitation.
· This rule does not prove HTTP/2 exploitation, memory exhaustion, application compromise, credential exposure, lateral movement, or actor attribution without supporting telemetry.
Detection Logic
· Identify HTTP/2 traffic to business-critical routes, listeners, virtual hosts, origins, API paths, ingress paths, service-mesh routes, administrative portals, or high-value application services.
· Prioritize abnormal request cancellation, high stream reset ratio, high incomplete stream ratio, high connection persistence, high request rejection, repeated protocol errors, header-limit events, frame-limit events, or request-to-response imbalance.
· Correlate route-targeted behavior with source clusters, rare autonomous systems, unusual geographies, hosting providers, proxy networks, unusual TLS fingerprints, abnormal client fingerprints, or repeated user-agent patterns.
· Increase confidence when affected routes show elevated 400, 413, 431, 499, 502, 503, 504, upstream timeout, gateway timeout, backend latency, application error increase, or user-facing degradation.
· Increase confidence when route-targeted behavior aligns with memory pressure, CPU pressure, worker exhaustion, queue growth, event-loop delay, target-health degradation, pod restart, container eviction, autoscaling surge, or service degradation.
· Increase confidence when similar activity appears across multiple edge nodes, origins, regions, tenants, routes, or service tiers.
· Reduce severity when route impact aligns with approved load testing, performance testing, synthetic monitoring, resilience testing, vulnerability scanning, deployment activity, failover, partner integration behavior, security testing, or known traffic growth.
· Do not treat route targeting, traffic volume, source novelty, request rejection, response errors, or route latency as HTTP/2 exploitation without supporting protocol, resource, and operational-context evidence.
· Do not use CVE identifiers, proof-of-concept names, source IPs, user agents, or scanner names as the primary detection model.
Required Telemetry
· SIEM log-source inventory.
· SIGMA target-backend mapping.
· Web-server logs.
· Reverse-proxy logs.
· CDN logs where available.
· WAF logs where available.
· Load-balancer logs.
· API-gateway logs where available.
· Ingress-controller logs where available.
· Service-mesh telemetry where available.
· Network telemetry where available.
· HTTP protocol version.
· Source IP.
· Source autonomous system where available.
· Source geolocation where available.
· Source network type where available.
· User agent where available.
· TLS fingerprint where available.
· Client fingerprint where available.
· Virtual host.
· Route.
· Listener.
· Origin.
· Business service.
· Tenant where available.
· Request count.
· Connection count.
· Stream count where available.
· Stream reset count where available.
· Request cancellation count where available.
· Completed request count where available.
· Response code.
· Request rejection reason where available.
· Header-limit event where available.
· Frame-limit event where available.
· Protocol-error event where available.
· Request timing.
· Response time.
· Byte count.
· Backend latency.
· Application latency.
· Application error rate.
· Resource telemetry where available.
· Cloud telemetry where available.
· Kubernetes telemetry where available.
· Route criticality inventory.
· Application ownership inventory.
· Approved route baseline.
· Approved testing records.
· Change-control records or approved-activity enrichment.
· Incident-response records.
Engineering Implementation Instructions
· Convert this SIGMA rule only after the target SIEM backend, field schema, log sources, business-route inventory, source enrichment, route baseline, correlation support, and enrichment availability are validated.
· Build field mappings for HTTP protocol version, URL path, route, virtual host, listener, origin, business service, tenant, source IP, user agent, TLS fingerprint, client fingerprint, response code, request result, request rejection reason, and application latency.
· Build portable route-anomaly selections for high stream churn, high stream reset ratio, high request cancellation ratio, high incomplete stream ratio, high connection persistence, request-to-response imbalance, low completed-request ratio, repeated protocol errors, repeated header-limit events, repeated frame-limit events, and request rejection spike.
· Build source-context enrichment for repeated source clusters, rare autonomous systems, unusual geographies, hosting providers, proxy networks, unusual TLS fingerprints, abnormal client fingerprints, and repeated user-agent patterns.
· Build service-impact enrichment for memory pressure, CPU pressure, worker exhaustion, queue growth, event-loop delay, gateway errors, target-health degradation, backend latency, pod restart, container eviction, autoscaling surge, application error increase, and user-facing degradation.
· Build approved-activity enrichment for load testing, performance testing, resilience testing, synthetic monitoring, vulnerability scanning, deployments, failovers, traffic-growth events, partner integrations, security testing, incident response, and approved route changes.
· Use target-platform correlation features to join business-route targeting, source context, response-error patterns, service impact, and approved-activity suppression.
· Use short correlation windows for intense route-targeted anomalies affecting business-critical services.
· Use moderate correlation windows when route-targeted anomalies are lower-rate but align with resource pressure, source clustering, or service-impact telemetry.
· Use longer correlation windows only when repeated route targeting, retained protocol telemetry, incident-response evidence, or application-impact evidence supports delayed linkage.
· Add severity weighting in the target SIEM for business-critical route class, authentication impact, API impact, payment workflow impact, customer-facing impact, high reset ratio, low completion ratio, source clustering, resource pressure, service degradation, and absence of approved operational activity.
· Validate converted query syntax, backend field names, parser behavior, event timestamps, time-zone handling, ingestion delay, enrichment joins, exception logic, correlation windows, query performance, and false-positive baselines before production deployment.
· Treat business-critical route degradation as a priority amplifier, not standalone proof of HTTP/2 exploitation.
· Do not enable alert mode until local telemetry, backend conversion, field mapping, business-route inventory, route baselines, source enrichment, service-impact visibility, exceptions, query performance, and SOC triage workflow are validated.
DRI Assessment
DRI
8.0 / 10
· The rule is behaviorally anchored to durable route-targeted HTTP/2 resource-exhaustion behavior and business-impact correlation rather than static indicators, CVE identifiers, proof-of-concept names, user agents, or source IPs.
· The rule remains useful if an adversary changes source distribution, traffic rate, user agent, request timing, route sequence, stream behavior mix, or HTTP/2 abuse variant.
· The score is supported by the durability of route targeting, source clustering, request cancellation, stream reset behavior, request rejection, protocol errors, traffic imbalance, and route-level impact against business-critical services.
· The score is constrained by SIGMA’s dependence on target-platform field mapping, backend support for multi-stage correlation, business-route inventory, source enrichment, and service-impact telemetry.
· The rule is durable as a portable route-impact and resource-exhaustion pattern but should not be treated as standalone proof of exploitation or compromise.
TCR Assessment
Operational TCR
7.1 / 10
Full-Telemetry TCR
8.5 / 10
· Operational confidence depends on accurate backend conversion, business-route inventory, HTTP/2 protocol visibility, route baselines, response-code telemetry, source context, resource telemetry, application telemetry, and target-SIEM correlation quality.
· Operational confidence is reduced where business-route mapping is incomplete, HTTP/2 metadata is unavailable, CDN or WAF logs are sampled, the target backend lacks correlation support, or application telemetry cannot be tied to route-level impact.
· Operational confidence is reduced during load testing, synthetic monitoring, vulnerability scanning, security testing, deployment activity, failover, traffic growth, partner integration changes, or application performance incidents.
· Full-telemetry confidence improves when the target SIEM correlates route telemetry with CDN logs, WAF logs, proxy logs, load-balancer logs, API-gateway logs, ingress logs, service-mesh telemetry, network telemetry, resource telemetry, cloud logs, Kubernetes logs, application performance telemetry, and approved-activity records.
· Even under full telemetry conditions, this rule should support high-priority investigation and exposure scoping rather than standalone confirmation of exploit success.
Limitations
· SIGMA is a portable rule format and does not guarantee field availability, parser behavior, multi-stage correlation support, or performance in the target SIEM.
· Business-critical route degradation can result from normal customer traffic, application regressions, backend dependency failures, deployments, failovers, security testing, or load testing.
· Weak route inventory or application ownership mapping can reduce confidence.
· CDN, WAF, proxy, and load-balancer layers may mask source behavior or normalize route-level anomalies.
· Frame-level HTTP/2 telemetry may be unavailable or retained only briefly.
· The rule may miss attacks that affect low-visibility routes or are absorbed by upstream mitigations.
· The rule should not be used for actor attribution without incident-specific intelligence, validated behavioral correlation, or confirmed victim-environment evidence.
Detection Query Pattern
SIGMA HTTP/2 business-critical route targeting correlation pattern requiring backend conversion, field mapping, business-route validation, source-enrichment validation, HTTP/2 field validation, service-impact validation, route-baseline validation, timing-window tuning, approved operational allowlisting, and false-positive testing before production deployment. This pattern should be implemented as a target-SIEM correlation rule. The YAML below represents the portable route-targeting event-selection component only and must be correlated with source-context and service-impact evidence in the target platform.
title: HTTP2 Business Critical Route Targeting With Source And Error Pattern Correlation
id: cyberdax-http2-business-route-source-error-correlation
status: experimental
description: Detects HTTP/2 anomaly patterns targeting business-critical routes that require source, response-error, and service-impact correlation.
logsource:
category: webserver
detection:
selection_http2:
http.version:
- HTTP/2
- h2
- h2c
selection_business_route:
cyberdax.route.category:
- authentication
- api
- payment
- customer_portal
- saas_front_end
- cloud_ingress
- kubernetes_ingress
- service_mesh_ingress
- administrative_portal
- business_critical
selection_http2_behavior:
http2.behavior:
- high_stream_churn
- high_stream_reset_ratio
- high_request_cancellation_ratio
- high_incomplete_stream_ratio
- high_connection_persistence
- request_response_imbalance
- low_completed_request_ratio
- repeated_protocol_errors
- repeated_header_limit_events
- repeated_frame_limit_events
- request_rejection_spike
selection_response_errors:
http.response.status_code:
- 400
- 413
- 431
- 499
- 502
- 503
- 504
condition: selection_http2 and selection_business_route and (selection_http2_behavior or selection_response_errors)
fields:
· source.ip
· user_agent.original
· http.version
· http.response.status_code
· url.path
· event.reason
· cyberdax.route.category
falsepositives:
· Approved load testing.
· Approved performance testing.
· Approved resilience testing.
· Approved synthetic monitoring.
· Approved vulnerability scanning.
· Approved partner integration.
· Approved deployment activity.
· Approved failover activity.
· Approved traffic growth event.
· Approved security testing.
· Approved incident response.
level: medium
Correlate this event-selection component in the target SIEM with source-context enrichment and service-impact telemetry for the same route, service lineage, origin, workload, or application. Promote severity only when source clustering or service-impact evidence exists and approved operational activity is excluded.
YARA
Detection Viability Assessment
YARA has zero primary rules for this EXP report.
· YARA is not recommended for primary S25 detection because the governing detection model is behavior-led, not artifact-led.
· The report’s strongest detection coverage comes from HTTP/2-facing source behavior, abnormal request cancellation, stream reset behavior, protocol anomalies, edge-to-origin retry expansion, gateway-to-backend pressure, resource pressure, memory exhaustion indicators, worker instability, route degradation, service-impact telemetry, application degradation, CDN / WAF / proxy / load-balancer / API-gateway telemetry, ingress telemetry, service-mesh telemetry, endpoint or workload instability, cloud telemetry, Kubernetes telemetry, and downstream SIEM correlation.
· YARA does not observe HTTP/2 frame sequencing, CONTINUATION-frame behavior, HPACK processing behavior, stream lifecycle behavior, request cancellation behavior, source clustering, CDN-to-origin retry expansion, gateway-to-backend pressure, route degradation, memory pressure, autoscaling behavior, load-balancer target-health changes, Kubernetes pod instability, cloud telemetry, application telemetry, or backend SIEM correlation context.
· YARA can support optional investigative hunting if responders recover a stable artifact during incident response, such as a webshell, loader, dropper, staged script, malicious module, exploit payload, memory artifact, suspicious binary, encoded payload, configuration artifact, crash artifact, or reusable file-content pattern linked to HTTP/2-facing infrastructure impact.
· Including a primary YARA rule would create unnecessary artifact dependency and would be weaker than the accepted behavior-led rule sets for NDR / Network Behavioral Analytics, SentinelOne, Splunk, Elastic, QRadar, and SIGMA.
· YARA should remain a conditional investigative control rather than a primary detection system unless stable artifact evidence becomes available from the affected environment.
· YARA should not be used to infer successful HTTP/2 exploitation, memory exhaustion, application compromise, host compromise, web infrastructure compromise, credential exposure, persistence, lateral movement, cloud compromise, Kubernetes compromise, deployment compromise, endpoint compromise, data access, or actor attribution without supporting endpoint, identity, network, web, proxy, WAF, CDN, load-balancer, API-gateway, ingress, service-mesh, application, cloud, Kubernetes, deployment, file, memory, or incident-response evidence.
Final Disposition
No primary YARA rule is included.
AWS
Detection Viability Assessment
AWS has three rules for this EXP report.
· AWS is viable for detecting cloud-side evidence associated with HTTP/2 header abuse and memory exhaustion across AWS-hosted web infrastructure when CloudFront, AWS WAF, Application Load Balancer, Network Load Balancer where applicable, API Gateway, ECS, EKS, EC2, Lambda, CloudWatch, VPC Flow Logs, CloudTrail, GuardDuty, Route 53 Resolver logs, autoscaling, container, workload, application, and approved-activity telemetry can be correlated.
· AWS is strongest where HTTP/2-facing edge and application telemetry exposes protocol version where available, route, host, listener, target group, origin, response code, WAF action, request rejection, request timing, target response time, target health, autoscaling activity, container instability, pod instability, memory pressure, application errors, and approved operational context.
· AWS can support durable detection even when HTTP/2 frame-level telemetry is incomplete, provided the detection logic correlates abnormal edge behavior, source behavior, WAF / CDN / load-balancer anomalies, target-health changes, backend resource pressure, application degradation, and absence of approved operational activity.
· AWS is not a standalone source for confirming HTTP/2 CONTINUATION-frame exploitation, Rapid Reset-style exploitation, memory exhaustion, application compromise, host compromise, persistence, lateral movement, credential exposure, cloud compromise, or actor attribution unless the underlying telemetry provides sufficient protocol, endpoint, workload, application, identity, network, cloud-control-plane, and incident-response evidence.
· AWS detections must avoid high-confidence alerting from one CloudFront error spike, one AWS WAF block spike, one ALB 5xx spike, one API Gateway error spike, one target-health change, one autoscaling event, one ECS task restart, one EKS pod restart, one Lambda error spike, one memory-pressure event, one GuardDuty finding, or one CloudWatch alarm without supporting correlation.
· AWS rule logic should prioritize multi-signal behavior: HTTP/2-facing edge anomaly plus source behavior plus target or workload pressure plus application impact plus approved-activity validation.
Rule
AWS HTTP/2 Edge Anomaly With Target Resource and Service-Impact Correlation
Rule Format
AWS cloud-edge and workload correlation rule suitable for CloudFront logs, AWS WAF logs, Application Load Balancer logs, Network Load Balancer logs where available, API Gateway access logs, VPC Flow Logs, CloudWatch metrics and logs, ECS telemetry, EKS telemetry, EC2 telemetry, Lambda telemetry, application logs, Route 53 Resolver logs where available, CloudTrail, GuardDuty findings where available, approved-activity records, asset inventory, service-lineage mapping, and SIEM correlation after log-source validation, field mapping, timing-window tuning, baseline validation, and environment-specific allowlisting.
Detection Purpose
· Detect HTTP/2-facing edge anomalies that align with target resource pressure, workload instability, or service degradation in AWS-hosted web infrastructure.
· Identify suspicious CloudFront, AWS WAF, ALB, API Gateway, ingress, service-mesh, ECS, EKS, EC2, Lambda, or application behavior involving request rejection, protocol errors, elevated 4xx / 5xx responses, target response-time growth, target-health degradation, memory pressure, worker exhaustion, container instability, pod instability, or application degradation.
· Prioritize AWS-hosted authentication paths, API routes, customer portals, payment workflows, SaaS front ends, CloudFront origins, ALB target groups, API Gateway stages, EKS ingress paths, ECS services, Lambda-backed APIs, and business-critical workloads.
· Support escalation when AWS edge anomalies align with abnormal source behavior, route sensitivity, resource pressure, workload instability, application impact, and absence of approved operational activity.
· Preserve separation between suspicious AWS-side behavior and confirmed exploitation by requiring resource, service-impact, approved-activity, or incident-response evidence before classifying activity as probable exploitation.
· This rule does not prove HTTP/2 exploitation, memory exhaustion, application compromise, host compromise, persistence, lateral movement, credential exposure, cloud compromise, or actor attribution without supporting telemetry.
Detection Logic
· Identify HTTP/2-facing traffic and service events from CloudFront, AWS WAF, ALB, API Gateway, ingress, service-mesh, ECS, EKS, EC2, Lambda, or application front ends.
· Prioritize HTTP/2-facing events showing elevated protocol errors, request rejection, WAF rule action spikes, elevated 400, 413, 431, client disconnect patterns where available, 502, 503, 504, target response-time growth, origin error increase, or gateway timeout patterns.
· Correlate edge anomalies with resource-impact or workload-impact events involving memory pressure, CPU pressure, worker exhaustion, queue growth, process restart, service restart, ECS task restart, EKS pod restart, node pressure, container eviction, Lambda error increase, out-of-memory behavior, or application error increase.
· Increase confidence when affected services support authentication paths, API routes, payment workflows, customer portals, SaaS front ends, CloudFront origins, ALB target groups, API Gateway stages, EKS ingress paths, ECS services, Lambda-backed APIs, or other business-critical workloads.
· Increase confidence when source clusters, autonomous systems, geographies, user agents, TLS fingerprints where available, client fingerprints where available, or proxy paths generate similar HTTP/2-facing anomaly patterns across multiple CloudFront distributions, WAF web ACLs, ALBs, API stages, origins, target groups, regions, accounts, or workloads.
· Increase confidence when CloudWatch, ECS, EKS, EC2, Lambda, application, or SIEM telemetry shows target-health degradation, autoscaling surge, backend latency, memory pressure, application degradation, user-facing errors, or incident-response evidence in the same service lineage.
· Reduce severity when activity aligns with approved load testing, performance testing, resilience testing, synthetic monitoring, vulnerability scanning, deployment activity, failover, autoscaling, maintenance, security testing, WAF tuning, CDN configuration change, incident-response activity, or emergency mitigation.
· Do not classify CloudFront errors, WAF blocks, ALB errors, API Gateway errors, target-health changes, autoscaling, ECS restarts, EKS restarts, Lambda errors, CloudWatch alarms, or GuardDuty findings as probable HTTP/2 exploitation without multi-signal correlation.
· Do not use source IPs, user agents, proof-of-concept names, scanner names, CVE identifiers, or single AWS service events as the primary detection basis.
Required Telemetry
· CloudFront logs.
· AWS WAF logs.
· Application Load Balancer logs.
· Network Load Balancer logs where available.
· API Gateway access logs where available.
· VPC Flow Logs where available.
· Route 53 Resolver logs where available.
· CloudWatch metrics.
· CloudWatch logs.
· ECS telemetry where available.
· EKS telemetry where available.
· EC2 telemetry where available.
· Lambda telemetry where available.
· Application logs.
· CloudTrail.
· GuardDuty findings where available.
· HTTP protocol version where available.
· Source IP.
· Source autonomous system where available.
· Source geolocation where available.
· User agent where available.
· TLS or client fingerprint where available.
· CloudFront distribution.
· WAF web ACL.
· WAF rule action.
· ALB listener.
· ALB target group.
· API Gateway stage.
· Route.
· Host.
· Origin.
· Target.
· Backend service.
· ECS service.
· EKS namespace.
· EKS service.
· EKS pod.
· EC2 instance.
· Lambda function.
· Response code.
· Request result.
· Target status code.
· Target response time.
· Origin response time.
· Request rejection reason where available.
· Protocol-error indicator where available.
· Request count.
· Connection count where available.
· Byte count.
· Memory utilization.
· CPU utilization.
· Autoscaling activity.
· Target-health state.
· Container restart telemetry where available.
· Pod restart telemetry where available.
· Application error telemetry.
· AWS-hosted service inventory.
· Business-critical route inventory.
· Approved-activity records.
· Change-control records.
· Approved testing records.
· Incident-response records.
Engineering Implementation Instructions
· Build AWS asset groups covering CloudFront distributions, AWS WAF web ACLs, ALB listeners, ALB target groups, API Gateway stages, ECS services, EKS services, EKS ingress paths, EC2-backed application services, Lambda-backed APIs, and business-critical AWS-hosted workloads.
· Build service-lineage mappings connecting CloudFront distributions, WAF web ACLs, ALB listeners, target groups, API Gateway stages, origins, ECS services, EKS services, EC2 instances, Lambda functions, routes, tenants, accounts, regions, and business applications.
· Build edge-anomaly groups covering elevated request rejection, WAF action spikes, protocol errors, elevated 4xx / 5xx responses, target response-time growth, origin error increase, gateway timeout increase, target-health degradation, and abnormal source clustering.
· Build resource-impact groups covering memory pressure, CPU pressure, worker exhaustion, queue growth, ECS task restart, EKS pod restart, node pressure, container eviction, Lambda error increase, out-of-memory behavior, autoscaling surge, application error increase, and user-facing degradation.
· Build approved-activity groups for load testing, performance testing, resilience testing, synthetic monitoring, vulnerability scanning, deployments, failovers, autoscaling, maintenance, security testing, WAF tuning, CDN configuration changes, incident response, and emergency mitigation.
· Validate whether AWS logs and metrics can be joined on CloudFront distribution, WAF web ACL, ALB listener, target group, origin, API Gateway stage, ECS service, EKS namespace, pod, EC2 instance, Lambda function, route, timestamp, region, account, and business service.
· Use short correlation windows when edge anomalies and resource pressure occur together on the same service lineage.
· Use moderate correlation windows when resource pressure follows lower-rate edge anomalies.
· Use longer correlation windows only when retained protocol telemetry, incident-response evidence, application-impact telemetry, or workload lineage supports delayed linkage.
· Add severity weighting for business-critical route impact, repeated edge anomalies, distributed source behavior, WAF action spikes, target-health degradation, memory pressure, container instability, autoscaling surge, application degradation, and absence of approved operational activity.
· Validate log availability, CloudWatch metric coverage, CloudTrail event coverage, field mappings, service-lineage mappings, timestamps, time-zone handling, ingestion delay, correlation windows, exception logic, query performance, and false-positive baselines before production deployment.
· Treat AWS correlation output as investigation-ready evidence until local rule performance, field completeness, and SOC triage workflow are validated.
· Do not enable alert mode until AWS log sources, metric sources, field mappings, service-lineage mappings, enrichment, baselines, exceptions, query performance, and SOC triage workflow are validated.
DRI Assessment
DRI
8.1 / 10
· The rule is behaviorally anchored to durable AWS edge, workload, resource-impact, and approved-activity correlation rather than static indicators, CVE identifiers, source IPs, user agents, or proof-of-concept names.
· The rule remains useful if an adversary changes source infrastructure, user agent, request timing, route targeting, CloudFront distribution targeting, ALB target group targeting, API route targeting, or HTTP/2 abuse variant.
· The score is supported by AWS telemetry correlation across CloudFront, WAF, ALB, API Gateway, CloudWatch, ECS, EKS, EC2, Lambda, application logs, CloudTrail, GuardDuty findings where available, and approved-activity context.
· The score is constrained by incomplete HTTP/2 metadata, CDN normalization, WAF abstraction, ALB field limitations, managed-service visibility gaps, weak service-lineage mapping, and benign operational activity that can produce similar symptoms.
· The rule is durable as an AWS cloud-edge and workload-impact correlation detector but should not be treated as standalone proof of exploitation.
TCR Assessment
Operational TCR
7.4 / 10
Full-Telemetry TCR
8.7 / 10
· Operational confidence depends on accurate CloudFront, WAF, ALB, API Gateway, ECS, EKS, EC2, Lambda, CloudWatch, CloudTrail, application-log, service-lineage, and approved-activity telemetry.
· Operational confidence is reduced where HTTP/2 fields are unavailable, CloudFront or WAF logs are sampled or delayed, ALB context is incomplete, target-health data is incomplete, or resource telemetry cannot be tied to affected services.
· Operational confidence is reduced during load testing, synthetic monitoring, vulnerability scanning, deployments, failovers, maintenance, autoscaling, WAF tuning, CDN changes, security testing, incident response, or legitimate traffic surges.
· Full-telemetry confidence improves when AWS edge logs, workload telemetry, CloudWatch metrics, CloudTrail events, application telemetry, EKS telemetry, ECS telemetry, GuardDuty findings, and approved-activity records are correlated.
· Even under full telemetry conditions, this rule should support high-confidence escalation only after field validation, timing validation, and false-positive review.
Limitations
· AWS telemetry may not expose full HTTP/2 frame-level behavior or CONTINUATION-frame detail.
· CloudFront, WAF, ALB, API Gateway, and managed-service layers may normalize or abstract protocol behavior.
· Resource telemetry may show pressure without proving HTTP/2 causality.
· Autoscaling, deployment activity, failover, resilience testing, load testing, WAF tuning, CDN changes, security testing, and legitimate traffic growth can produce similar symptoms.
· The rule may miss activity absorbed by CloudFront or AWS WAF before reaching origins or workloads.
· The rule may miss low-and-slow activity that degrades service without breaching CloudWatch, target-health, or application thresholds.
· The rule should not be used for actor attribution without incident-specific intelligence, validated behavioral correlation, or confirmed victim-environment evidence.
Detection Query Pattern
AWS HTTP/2 edge anomaly and resource-impact correlation query pattern requiring AWS log-source validation, metric-source validation, field mapping, service-lineage validation, timing-window tuning, approved operational allowlisting, and false-positive testing before production deployment. In production, this pattern should be implemented through SIEM correlation, CloudWatch metric filters and alarms, EventBridge rules, Security Lake / Athena queries, or platform-native detections depending on telemetry architecture.
CloudFrontOrWAFOrALBEvent AS AWSEdgeAnomaly
WHERE AWSEdgeAnomaly.Service IN ANY (
"CloudFront",
"AWS WAF",
"Application Load Balancer",
"API Gateway",
"Ingress",
"Service Mesh"
)
AND (
AWSEdgeAnomaly.ProtocolVersion IN ANY (
"HTTP/2",
"h2",
"h2c"
)
OR AWSEdgeAnomaly.HTTPVersion IN ANY (
"HTTP/2",
"h2",
"h2c"
)
OR AWSEdgeAnomaly.Service IN ANY (
"CloudFront",
"AWS WAF",
"Application Load Balancer",
"API Gateway"
)
)
AND (
AWSEdgeAnomaly.EventPattern IN ANY (
"request_rejection_spike",
"protocol_error_increase",
"waf_action_spike",
"target_response_time_growth",
"origin_error_increase",
"gateway_timeout_increase",
"target_health_degradation",
"source_cluster_anomaly"
)
OR AWSEdgeAnomaly.ResponseCode IN ANY (
400,
413,
431,
502,
503,
504
)
)
CloudWatchOrWorkloadEvent AS AWSResourceImpact
WHERE AWSResourceImpact.ServiceLineage IN SAME_SERVICE_LINEAGE(AWSEdgeAnomaly.ServiceLineage)
AND AWSResourceImpact.EventPattern IN ANY (
"memory_pressure",
"cpu_pressure",
"worker_exhaustion",
"queue_growth",
"ecs_task_restart",
"eks_pod_restart",
"node_pressure",
"container_eviction",
"lambda_error_increase",
"out_of_memory_behavior",
"autoscaling_surge",
"application_error_increase",
"user_facing_degradation"
)
Suppress or downgrade when approved-activity context matches approved load testing, performance testing, resilience testing, synthetic monitoring, vulnerability scanning, deployment, failover, autoscaling, maintenance, WAF tuning, CDN change, security testing, incident response, or emergency mitigation.
Rule
AWS Edge-to-Origin Retry Expansion and Target-Health Degradation
Rule Format
AWS cloud-edge and origin-impact correlation rule suitable for CloudFront logs, AWS WAF logs, ALB logs, API Gateway access logs, CloudWatch metrics, ALB target-health telemetry, ECS telemetry, EKS telemetry, EC2 telemetry, Lambda telemetry, application telemetry, VPC Flow Logs where available, CloudTrail, approved-activity records, route inventory, target-group inventory, origin inventory, service-lineage mapping, and SIEM correlation after target-lineage validation, retry-baseline validation, timing-window tuning, and environment-specific allowlisting.
Detection Purpose
· Detect edge-to-origin retry expansion, timeout growth, target-health degradation, origin error increase, backend saturation, or route-level degradation affecting AWS-hosted web infrastructure.
· Identify when HTTP/2-facing pressure propagates from CloudFront, AWS WAF, ALB, API Gateway, ingress, or service-mesh layers into origins, target groups, ECS services, EKS services, EC2-backed workloads, Lambda-backed APIs, or business-critical application routes.
· Prioritize authentication routes, API routes, payment workflows, customer portals, SaaS front ends, CloudFront origins, ALB target groups, API Gateway stages, EKS ingress paths, ECS services, and high-value application services.
· Support escalation when retry expansion or target-health degradation aligns with HTTP/2-facing anomalies, source clusters, resource pressure, application errors, autoscaling activity, and absence of approved operational activity.
· Preserve separation between service-impact correlation and confirmed exploitation by requiring supporting protocol, source, resource, route, approved-activity, or incident-response evidence before classifying activity as probable exploitation.
· This rule does not prove HTTP/2 exploitation, memory exhaustion, backend compromise, application compromise, cloud compromise, or actor attribution without supporting telemetry.
Detection Logic
· Identify edge-to-origin, ALB-to-target, API Gateway-to-integration, ingress-to-service, or service-mesh-to-backend communication affecting AWS-hosted web infrastructure.
· Prioritize retry expansion, timeout growth, upstream reset increase, connection refusal, target response-time growth, target-health degradation, origin error increase, backend saturation, route latency, application error increase, or autoscaling surge.
· Correlate service-impact patterns with related HTTP/2-facing anomalies such as request rejection, WAF action spikes, protocol errors, gateway errors, source clustering, elevated 4xx / 5xx responses, or target response-time anomalies.
· Increase confidence when route degradation affects business-critical application paths, CloudFront origins, ALB target groups, API Gateway stages, ECS services, EKS services, EC2 workloads, Lambda-backed APIs, or SaaS front ends.
· Increase confidence when backend pressure aligns with memory pressure, CPU pressure, worker exhaustion, queue growth, ECS task restart, EKS pod restart, node pressure, container eviction, Lambda error increase, autoscaling surge, or application degradation.
· Increase confidence when similar edge-to-origin degradation appears across multiple CloudFront distributions, WAF web ACLs, ALBs, target groups, origins, API stages, regions, accounts, or business services.
· Reduce severity when activity matches approved load testing, failover, deployment, resilience testing, synthetic monitoring, vulnerability scanning, backend maintenance, WAF change, CDN change, ingress change, service-mesh change, security testing, autoscaling, incident-response activity, or emergency mitigation.
· Do not classify retry expansion, gateway timeouts, route latency, origin errors, target-health degradation, or autoscaling surge as HTTP/2 exploitation without supporting HTTP/2-facing source, route, resource, or operational-context evidence.
· Do not interpret defensive telemetry export, health-check traffic, autoscaling activity, CloudWatch alarm activity, or mitigation-control activation as adversary-controlled outbound communication without host, process, identity, destination, and incident-response evidence.
Required Telemetry
· CloudFront logs.
· AWS WAF logs.
· Application Load Balancer logs.
· API Gateway access logs where available.
· VPC Flow Logs where available.
· CloudWatch metrics.
· CloudWatch logs.
· ALB target-health telemetry.
· ECS telemetry where available.
· EKS telemetry where available.
· EC2 telemetry where available.
· Lambda telemetry where available.
· Application performance telemetry.
· CloudTrail.
· Edge node or distribution identifier.
· WAF web ACL.
· ALB listener.
· ALB target group.
· API Gateway stage.
· Origin.
· Backend service.
· Destination service.
· Route.
· Host.
· Response code.
· Target status code.
· Upstream result where available.
· Connection result where available.
· Retry count where available.
· Timeout count where available.
· Target response time.
· Origin response time.
· Target-health status.
· Request count.
· Byte count.
· Backend latency.
· Application latency.
· Application error rate.
· Memory utilization.
· CPU utilization.
· Autoscaling activity.
· ECS task state where available.
· EKS pod state where available.
· EC2 instance state where available.
· Lambda error telemetry where available.
· Route-to-service mapping.
· Target-group inventory.
· Origin inventory.
· Business-critical route inventory.
· Approved-activity records.
· Change-control records.
· Approved testing records.
· Incident-response records.
Engineering Implementation Instructions
· Build AWS service-lineage maps connecting CloudFront distributions, WAF web ACLs, ALB listeners, target groups, API Gateway stages, origins, ECS services, EKS services, EC2 instances, Lambda functions, routes, tenants, accounts, regions, and business applications.
· Build target and backend groups covering ALB target groups, ECS services, EKS services, EC2-backed application services, Lambda-backed APIs, service-mesh upstreams, and business-critical dependencies.
· Build service-impact groups covering retry expansion, timeout growth, upstream reset increase, connection refusal, target response-time growth, target-health degradation, origin error increase, backend saturation, route latency, application error increase, and autoscaling surge.
· Build HTTP/2-facing anomaly enrichment for CloudFront errors, WAF action spikes, ALB errors, API Gateway errors, protocol errors, request rejection, source clustering, route sensitivity, target response-time anomalies, and elevated 4xx / 5xx patterns.
· Build approved-activity groups for load testing, performance testing, resilience testing, synthetic monitoring, vulnerability scanning, deployments, failovers, backend maintenance, WAF change, CDN change, ingress change, service-mesh change, autoscaling, security testing, incident response, and emergency mitigation.
· Validate whether AWS logs and metrics can join on CloudFront distribution, WAF web ACL, ALB listener, target group, API Gateway stage, origin, ECS service, EKS namespace, EKS service, pod, EC2 instance, Lambda function, route, timestamp, region, account, and business service.
· Use short correlation windows when edge-to-origin pressure occurs during active HTTP/2-facing anomaly windows.
· Use moderate correlation windows when target-health degradation or backend latency follows lower-rate HTTP/2-facing anomalies.
· Use longer correlation windows only when route-to-service lineage, application-impact telemetry, retained edge telemetry, or incident-response evidence supports delayed linkage.
· Add severity weighting for business-critical route impact, repeated retry expansion, target-health degradation, origin error increase, backend latency, autoscaling surge, resource pressure, and absence of approved operational activity.
· Validate telemetry coverage, field mappings, service-lineage mappings, retry baselines, target-health baselines, event timestamps, ingestion delay, timing windows, exception logic, query performance, and false-positive baselines before production deployment.
· Treat edge-to-origin retry expansion as a service-impact amplifier, not standalone proof of HTTP/2 exploitation.
· Do not enable alert mode until target-lineage mapping, retry baselines, target-health visibility, backend service mapping, enrichment, exceptions, query performance, and SOC triage workflow are validated.
DRI Assessment
DRI
8.0 / 10
· The rule is behaviorally anchored to durable AWS edge-to-origin service-impact propagation rather than static indicators, CVE identifiers, source IPs, user agents, or proof-of-concept names.
· The rule remains useful if an adversary changes source infrastructure, traffic timing, route selection, user agent, CloudFront distribution targeting, ALB targeting, API Gateway route targeting, or HTTP/2 behavior mix.
· The score is supported by the durability of retry expansion, timeout growth, target-health degradation, origin error increase, backend saturation, route latency, autoscaling surge, and application degradation.
· The score is constrained by CloudFront abstraction, WAF normalization, ALB field limitations, weak service-lineage mapping, backend dependency noise, deployment activity, failover activity, autoscaling noise, and security testing.
· The rule is durable as an AWS service-impact correlation detector but should not be treated as standalone proof of HTTP/2 exploitation.
TCR Assessment
Operational TCR
7.3 / 10
Full-Telemetry TCR
8.6 / 10
· Operational confidence depends on reliable route-to-service mapping, target-group mapping, retry telemetry, target-health telemetry, origin inventory, backend-service inventory, CloudWatch metrics, application telemetry, approved-activity records, and SIEM correlation quality.
· Operational confidence is reduced where CloudFront, WAF, ALB, API Gateway, ECS, EKS, EC2, Lambda, or application telemetry is sampled, incomplete, delayed, or disconnected from backend service context.
· Operational confidence is reduced during failovers, deployments, traffic shifting, autoscaling events, resilience testing, load testing, synthetic monitoring, vulnerability scanning, backend maintenance, WAF tuning, CDN changes, security testing, or incident response.
· Full-telemetry confidence improves when AWS edge logs, target-health telemetry, CloudWatch metrics, workload telemetry, application telemetry, CloudTrail events, and approved-activity records are correlated.
· Even under full telemetry conditions, this rule should support service-impact escalation and scoping rather than standalone confirmation of exploitation.
Limitations
· Edge-to-origin retry expansion can be caused by backend dependency failures, deployment regressions, autoscaling delays, failovers, WAF changes, CDN changes, security testing, or normal traffic surges.
· CloudFront, WAF, ALB, API Gateway, and managed-service layers may obscure original source behavior or normalize route-level anomalies.
· Weak service-lineage mapping can reduce confidence in linking edge anomalies to backend impact.
· AWS telemetry may not expose full HTTP/2 frame-level behavior or CONTINUATION-frame details.
· The rule may miss attacks fully absorbed by CloudFront or AWS WAF before backend impact occurs.
· The rule may miss low-and-slow activity that degrades service without triggering retry, target-health, CloudWatch, or application thresholds.
· The rule should not be used for actor attribution without incident-specific intelligence, validated behavioral correlation, or confirmed victim-environment evidence.
Detection Query Pattern
AWS edge-to-origin retry expansion and target-health degradation query pattern requiring AWS log-source validation, metric-source validation, service-lineage validation, retry-baseline validation, timing-window tuning, approved operational allowlisting, and false-positive testing before production deployment. In production, this pattern should be implemented through SIEM correlation, CloudWatch metric filters and alarms, EventBridge rules, Security Lake / Athena queries, or platform-native detections depending on telemetry architecture.
CloudFrontOrALBOrAPIGatewayEvent AS AWSServiceImpact
WHERE AWSServiceImpact.Service IN ANY (
"CloudFront",
"Application Load Balancer",
"API Gateway",
"Ingress",
"Service Mesh"
)
AND (
AWSServiceImpact.EventPattern IN ANY (
"retry_expansion",
"timeout_growth",
"upstream_reset_increase",
"connection_refusal_increase",
"target_response_time_growth",
"target_health_degradation",
"origin_error_increase",
"backend_saturation",
"route_latency_increase",
"application_error_increase",
"autoscaling_surge"
)
OR AWSServiceImpact.ResponseCode IN ANY (
502,
503,
504
)
)
CloudFrontOrWAFOrALBEvent AS RelatedHTTP2Anomaly
WHERE RelatedHTTP2Anomaly.ServiceLineage IN SAME_SERVICE_LINEAGE(AWSServiceImpact.ServiceLineage)
AND (
RelatedHTTP2Anomaly.ProtocolVersion IN ANY (
"HTTP/2",
"h2",
"h2c"
)
OR RelatedHTTP2Anomaly.HTTPVersion IN ANY (
"HTTP/2",
"h2",
"h2c"
)
OR RelatedHTTP2Anomaly.Service IN ANY (
"CloudFront",
"AWS WAF",
"Application Load Balancer",
"API Gateway"
)
)
AND RelatedHTTP2Anomaly.EventPattern IN ANY (
"request_rejection_spike",
"protocol_error_increase",
"waf_action_spike",
"source_cluster_anomaly",
"gateway_error_increase",
"target_response_time_anomaly",
"elevated_4xx",
"elevated_5xx"
)
Suppress or downgrade when approved-activity context matches approved load testing, performance testing, resilience testing, synthetic monitoring, vulnerability scanning, deployment, failover, backend maintenance, WAF change, CDN change, ingress change, service-mesh change, autoscaling, security testing, incident response, or emergency mitigation.
Rule
AWS Business-Critical Route Targeting With Cloud Workload Impact
Rule Format
AWS cloud-edge, route-impact, and workload-impact correlation rule suitable for CloudFront logs, AWS WAF logs, ALB logs, API Gateway logs, CloudWatch metrics, CloudWatch logs, ECS telemetry, EKS telemetry, EC2 telemetry, Lambda telemetry, VPC Flow Logs where available, application telemetry, CloudTrail, GuardDuty findings where available, approved-activity records, business-critical route inventory, workload inventory, source enrichment, and SIEM correlation after business-route validation, source-baseline validation, workload-lineage validation, timing-window tuning, and environment-specific allowlisting.
Detection Purpose
· Detect HTTP/2-facing anomaly patterns targeting business-critical AWS-hosted routes where source behavior, response errors, request rejection, WAF actions, target response-time changes, and workload-impact telemetry indicate resource-exhaustion pressure.
· Identify route-targeted behavior affecting authentication paths, APIs, payment workflows, customer portals, SaaS front ends, CloudFront origins, ALB listeners, API Gateway stages, EKS ingress paths, ECS services, Lambda-backed APIs, or high-value application services.
· Support escalation when route-targeted behavior aligns with source context, response errors, resource pressure, workload instability, application degradation, and absence of approved operational activity.
· Preserve separation between suspicious route targeting and confirmed exploitation by requiring supporting protocol, source, resource, service-impact, approved-activity, or incident-response evidence before classifying activity as probable exploitation.
· This rule does not prove HTTP/2 exploitation, memory exhaustion, application compromise, credential exposure, lateral movement, cloud compromise, deployment compromise, or actor attribution without supporting telemetry.
Detection Logic
· Identify HTTP/2-facing traffic to business-critical AWS-hosted routes, CloudFront origins, ALB listeners, ALB target groups, API Gateway stages, EKS ingress paths, ECS services, Lambda-backed APIs, or application front ends.
· Prioritize abnormal source clustering, request rejection, WAF action spikes, elevated 400, 413, 431, 502, 503, 504, gateway timeout patterns, target response-time growth, origin error increase, or route latency increase.
· Correlate route-targeted behavior with source clusters, rare autonomous systems, unusual geographies, hosting providers, proxy networks, unusual user agents, TLS fingerprints where available, client fingerprints where available, or repeated source patterns.
· Increase confidence when affected routes show memory pressure, CPU pressure, worker exhaustion, queue growth, target-health degradation, ECS task restart, EKS pod restart, container eviction, Lambda error increase, autoscaling surge, application error increase, or user-facing degradation.
· Increase confidence when similar route-targeted behavior appears across multiple CloudFront distributions, WAF web ACLs, ALBs, API Gateway stages, origins, regions, accounts, tenants, or service tiers.
· Reduce severity when route impact aligns with approved load testing, performance testing, synthetic monitoring, resilience testing, vulnerability scanning, deployment activity, failover, partner integration behavior, WAF tuning, CDN configuration changes, security testing, autoscaling, known traffic growth, or incident-response activity.
· Do not treat route targeting, source novelty, WAF blocks, CloudFront errors, ALB errors, API Gateway errors, target response-time growth, autoscaling, or route latency as HTTP/2 exploitation without supporting protocol, resource, and operational-context evidence.
· Do not use CVE identifiers, proof-of-concept names, source IPs, user agents, scanner names, or single cloud-service events as the primary detection model.
Required Telemetry
· CloudFront logs.
· AWS WAF logs.
· Application Load Balancer logs.
· API Gateway access logs where available.
· VPC Flow Logs where available.
· Route 53 Resolver logs where available.
· CloudWatch metrics.
· CloudWatch logs.
· ECS telemetry where available.
· EKS telemetry where available.
· EC2 telemetry where available.
· Lambda telemetry where available.
· Application performance telemetry.
· CloudTrail.
· GuardDuty findings where available.
· HTTP protocol version where available.
· Source IP.
· Source autonomous system where available.
· Source geolocation where available.
· Source network type where available.
· User agent where available.
· TLS or client fingerprint where available.
· CloudFront distribution.
· WAF web ACL.
· WAF rule action.
· ALB listener.
· ALB target group.
· API Gateway stage.
· Route.
· Host.
· Origin.
· Business service.
· Tenant where available.
· Request count.
· Connection count where available.
· Response code.
· Request result.
· Target status code.
· Target response time.
· Origin response time.
· Request rejection reason where available.
· Protocol-error indicator where available.
· Request timing.
· Byte count.
· Backend latency.
· Application latency.
· Application error rate.
· Memory utilization.
· CPU utilization.
· Target-health state.
· Autoscaling telemetry.
· ECS task state where available.
· EKS pod state where available.
· Lambda error telemetry where available.
· Business-critical route inventory.
· AWS workload inventory.
· Application ownership inventory.
· Approved route baseline.
· Approved testing records.
· Change-control records.
· Approved-activity records.
· Incident-response records.
Engineering Implementation Instructions
· Build AWS route groups covering authentication paths, API routes, payment workflows, customer portals, SaaS front ends, CloudFront origins, ALB listeners, API Gateway stages, EKS ingress paths, ECS services, Lambda-backed APIs, administrative portals, and high-value application services.
· Build workload-lineage groups connecting CloudFront distributions, WAF web ACLs, ALB listeners, target groups, API Gateway stages, origins, ECS services, EKS services, EC2 instances, Lambda functions, tenants, routes, accounts, regions, and business applications.
· Build source-context groups for repeated source clusters, rare autonomous systems, unusual geographies, hosting providers, proxy networks, unusual user agents, unusual TLS fingerprints where available, abnormal client fingerprints where available, and repeated source patterns.
· Build route-baseline fields for normal HTTP/2 request volume, WAF action rate, CloudFront error rate, ALB response-code distribution, API Gateway error rate, target response time, backend latency, application latency, and transaction-success ratio.
· Build AWS route-anomaly groups for request rejection, WAF action spikes, protocol-error indicators, elevated 4xx / 5xx responses, target response-time growth, origin error increase, gateway timeout increase, route latency increase, and source clustering.
· Build workload-impact groups for memory pressure, CPU pressure, worker exhaustion, queue growth, target-health degradation, ECS task restart, EKS pod restart, container eviction, Lambda error increase, autoscaling surge, application error increase, and user-facing degradation.
· Build approved-activity groups for load testing, performance testing, resilience testing, synthetic monitoring, vulnerability scanning, deployments, failovers, partner integrations, WAF tuning, CDN configuration changes, security testing, autoscaling, incident response, approved traffic-growth events, and emergency mitigation.
· Use short correlation windows for intense route-targeted anomalies affecting business-critical services.
· Use moderate correlation windows when route-targeted anomalies are lower-rate but align with workload pressure, source clustering, or service-impact telemetry.
· Use longer correlation windows only when repeated route targeting, retained edge telemetry, incident-response evidence, or application-impact evidence supports delayed linkage.
· Add severity weighting for business-critical route class, authentication impact, API impact, payment workflow impact, customer-facing impact, WAF action spikes, low completion indicators where available, source clustering, workload pressure, service degradation, and absence of approved operational activity.
· Validate AWS log sources, CloudWatch metrics, CloudTrail events, service-lineage mappings, route baselines, timing windows, exception logic, query performance, and false-positive baselines before production deployment.
· Treat business-critical AWS route degradation as a priority amplifier, not standalone proof of HTTP/2 exploitation.
· Do not enable alert mode until business-route inventory, route baselines, protocol fields, source enrichment, workload-impact visibility, exceptions, query performance, and SOC triage workflow are validated.
DRI Assessment
DRI
8.1 / 10
· The rule is behaviorally anchored to durable route-targeted HTTP/2-facing cloud-edge behavior and AWS workload-impact correlation rather than static indicators, CVE identifiers, proof-of-concept names, user agents, or source IPs.
· The rule remains useful if an adversary changes source distribution, traffic rate, user agent, request timing, route sequence, CloudFront distribution targeting, ALB target group targeting, API route targeting, or HTTP/2 abuse variant.
· The score is supported by the durability of route targeting, source clustering, WAF action spikes, request rejection, response errors, target response-time growth, target-health degradation, workload pressure, and route-level impact against business-critical AWS services.
· The score is constrained by legitimate traffic spikes, load testing, synthetic monitoring, vulnerability scanning, security testing, deployments, incomplete route baselines, weak application ownership mapping, managed-service abstraction, and limited HTTP/2 telemetry.
· The rule is durable as an AWS route-impact and workload-impact correlation detector but should not be treated as standalone proof of exploitation or compromise.
TCR Assessment
Operational TCR
7.4 / 10
Full-Telemetry TCR
8.7 / 10
· Operational confidence depends on accurate business-route inventory, HTTP/2 protocol visibility where available, CloudFront logging, WAF logging, ALB logging, API Gateway logging, route baselines, response-code telemetry, source context, CloudWatch metrics, workload telemetry, application telemetry, and SIEM correlation quality.
· Operational confidence is reduced where route mapping is incomplete, HTTP/2 metadata is unavailable, CloudFront or WAF logs are delayed, ALB context is incomplete, API Gateway logs are incomplete, or application telemetry cannot be tied to route-level impact.
· Operational confidence is reduced during load testing, synthetic monitoring, vulnerability scanning, security testing, deployment activity, failover, traffic growth, partner integration changes, WAF tuning, CDN changes, autoscaling, or application performance incidents.
· Full-telemetry confidence improves when AWS edge logs, CloudWatch metrics, ECS telemetry, EKS telemetry, EC2 telemetry, Lambda telemetry, application logs, CloudTrail events, GuardDuty findings, and approved-activity records are correlated.
· Even under full telemetry conditions, this rule should support high-priority investigation and exposure scoping rather than standalone confirmation of exploit success.
Limitations
· Business-critical AWS route degradation can result from normal customer traffic, application regressions, backend dependency failures, deployments, failovers, security testing, WAF tuning, CDN changes, autoscaling, or load testing.
· Weak route inventory or application ownership mapping can reduce confidence.
· CloudFront, WAF, ALB, API Gateway, and managed-service layers may mask source behavior or normalize route-level anomalies.
· AWS telemetry may not expose full HTTP/2 frame-level behavior or CONTINUATION-frame detail.
· The rule may miss attacks that affect low-visibility routes or are absorbed by CloudFront or AWS WAF before workload impact occurs.
· The rule may miss low-and-slow behavior that degrades service without breaching CloudWatch, target-health, or application thresholds.
· The rule should not be used for actor attribution without incident-specific intelligence, validated behavioral correlation, or confirmed victim-environment evidence.
Detection Query Pattern
AWS business-critical route targeting and workload-impact correlation query pattern requiring AWS log-source validation, metric-source validation, route inventory validation, source-enrichment validation, service-lineage validation, timing-window tuning, approved operational allowlisting, and false-positive testing before production deployment. In production, this pattern should be implemented through SIEM correlation, CloudWatch metric filters and alarms, EventBridge rules, Security Lake / Athena queries, or platform-native detections depending on telemetry architecture.
CloudFrontOrWAFOrALBOrAPIGatewayEvent AS AWSBusinessRouteAnomaly
WHERE AWSBusinessRouteAnomaly.Route IN ROUTE_GROUP (
"Authentication Routes",
"API Routes",
"Payment Routes",
"Customer Portals",
"SaaS Front Ends",
"CloudFront Origins",
"ALB Listener Routes",
"API Gateway Stages",
"EKS Ingress Routes",
"ECS Service Routes",
"Lambda Backed APIs",
"Business Critical Services"
)
AND (
AWSBusinessRouteAnomaly.ProtocolVersion IN ANY (
"HTTP/2",
"h2",
"h2c"
)
OR AWSBusinessRouteAnomaly.HTTPVersion IN ANY (
"HTTP/2",
"h2",
"h2c"
)
OR AWSBusinessRouteAnomaly.Service IN ANY (
"CloudFront",
"AWS WAF",
"Application Load Balancer",
"API Gateway"
)
)
AND (
AWSBusinessRouteAnomaly.EventPattern IN ANY (
"request_rejection_spike",
"waf_action_spike",
"protocol_error_increase",
"target_response_time_growth",
"origin_error_increase",
"gateway_timeout_increase",
"route_latency_increase",
"source_cluster_anomaly"
)
OR AWSBusinessRouteAnomaly.ResponseCode IN ANY (
400,
413,
431,
502,
503,
504
)
)
CloudWatchOrWorkloadEvent AS AWSWorkloadImpact
WHERE AWSWorkloadImpact.ServiceLineage IN SAME_SERVICE_LINEAGE(AWSBusinessRouteAnomaly.ServiceLineage)
AND AWSWorkloadImpact.EventPattern IN ANY (
"memory_pressure",
"cpu_pressure",
"worker_exhaustion",
"queue_growth",
"target_health_degradation",
"ecs_task_restart",
"eks_pod_restart",
"container_eviction",
"lambda_error_increase",
"autoscaling_surge",
"application_error_increase",
"user_facing_degradation"
)
Suppress or downgrade when approved-activity context matches approved load testing, performance testing, resilience testing, synthetic monitoring, vulnerability scanning, partner integration, deployment, failover, traffic-growth event, WAF tuning, CDN change, autoscaling, security testing, incident response, or emergency mitigation.
Azure
Detection Viability Assessment
Azure has three rules for this EXP report.
· Azure is viable for detecting cloud-side evidence associated with HTTP/2 header abuse and memory exhaustion across Azure-hosted web infrastructure when Azure Front Door, Azure Web Application Firewall, Application Gateway, Azure Load Balancer where applicable, Azure API Management, Azure App Service, Azure Kubernetes Service, Azure Container Apps, Azure Virtual Machines, Azure Monitor, Log Analytics, Microsoft Defender for Cloud, Microsoft Sentinel, NSG Flow Logs, Azure Activity Logs, container telemetry, workload telemetry, application telemetry, and approved-activity telemetry can be correlated.
· Azure is strongest where HTTP/2-facing edge and application telemetry exposes protocol version where available, route, host, listener, backend pool, origin, response code, WAF action, request rejection, request timing, backend response time, backend health, autoscaling activity, container instability, pod instability, memory pressure, application errors, and approved operational context.
· Azure can support durable detection even when HTTP/2 frame-level telemetry is incomplete, provided detection logic correlates abnormal edge behavior, source behavior, WAF / CDN / gateway anomalies, backend-health changes, workload resource pressure, application degradation, and absence of approved operational activity.
· Azure is not a standalone source for confirming HTTP/2 CONTINUATION-frame exploitation, Rapid Reset-style exploitation, memory exhaustion, application compromise, host compromise, persistence, lateral movement, credential exposure, cloud compromise, or actor attribution unless the underlying telemetry provides sufficient protocol, endpoint, workload, application, identity, network, cloud-control-plane, and incident-response evidence.
· Azure detections must avoid high-confidence alerting from one Azure Front Door error spike, one Azure WAF block spike, one Application Gateway 5xx spike, one API Management error spike, one backend-health change, one autoscaling event, one AKS pod restart, one Container Apps restart, one App Service error spike, one memory-pressure event, one Microsoft Defender for Cloud alert, or one Azure Monitor alert without supporting correlation.
· Azure rule logic should prioritize multi-signal behavior: HTTP/2-facing edge anomaly plus source behavior plus backend or workload pressure plus application impact plus approved-activity validation.
Rule
Azure HTTP/2 Edge Anomaly With Backend Resource and Service-Impact Correlation
Rule Format
Azure cloud-edge and workload correlation rule suitable for Azure Front Door logs, Azure Web Application Firewall logs, Application Gateway logs, Azure Load Balancer telemetry where applicable, Azure API Management logs, NSG Flow Logs where available, Azure Monitor metrics and logs, Log Analytics, Azure App Service telemetry, Azure Kubernetes Service telemetry, Azure Container Apps telemetry, Azure Virtual Machine telemetry, application logs, Azure Activity Logs, Microsoft Defender for Cloud alerts where available, approved-activity records, asset inventory, service-lineage mapping, and SIEM correlation after log-source validation, field mapping, timing-window tuning, baseline validation, and environment-specific allowlisting.
Detection Purpose
· Detect HTTP/2-facing edge anomalies that align with backend resource pressure, workload instability, or service degradation in Azure-hosted web infrastructure.
· Identify suspicious Azure Front Door, Azure WAF, Application Gateway, Azure API Management, ingress, service-mesh, AKS, Container Apps, App Service, Azure Virtual Machine, or application behavior involving request rejection, protocol errors, elevated 4xx / 5xx responses, backend response-time growth, backend-health degradation, memory pressure, worker exhaustion, container instability, pod instability, or application degradation.
· Prioritize Azure-hosted authentication paths, API routes, customer portals, payment workflows, SaaS front ends, Azure Front Door origins, Application Gateway backend pools, API Management routes, AKS ingress paths, Container Apps services, App Service applications, and business-critical workloads.
· Support escalation when Azure edge anomalies align with abnormal source behavior, route sensitivity, resource pressure, workload instability, application impact, and absence of approved operational activity.
· Preserve separation between suspicious Azure-side behavior and confirmed exploitation by requiring resource, service-impact, approved-activity, or incident-response evidence before classifying activity as probable exploitation.
· This rule does not prove HTTP/2 exploitation, memory exhaustion, application compromise, host compromise, persistence, lateral movement, credential exposure, cloud compromise, or actor attribution without supporting telemetry.
Detection Logic
· Identify HTTP/2-facing traffic and service events from Azure Front Door, Azure WAF, Application Gateway, Azure API Management, ingress, service-mesh, AKS, Container Apps, App Service, Azure Virtual Machines, or application front ends.
· Prioritize HTTP/2-facing events showing elevated protocol errors, request rejection, WAF rule action spikes, elevated 400, 413, 431, client disconnect patterns where available, 502, 503, 504, backend response-time growth, origin error increase, or gateway timeout patterns.
· Correlate edge anomalies with resource-impact or workload-impact events involving memory pressure, CPU pressure, worker exhaustion, queue growth, process restart, service restart, AKS pod restart, Container Apps restart, node pressure, container eviction, App Service error increase, out-of-memory behavior, or application error increase.
· Increase confidence when affected services support authentication paths, API routes, payment workflows, customer portals, SaaS front ends, Azure Front Door origins, Application Gateway backend pools, API Management routes, AKS ingress paths, Container Apps services, App Service applications, or other business-critical workloads.
· Increase confidence when source clusters, autonomous systems, geographies, user agents, TLS fingerprints where available, client fingerprints where available, or proxy paths generate similar HTTP/2-facing anomaly patterns across multiple Azure Front Door profiles, WAF policies, Application Gateways, API Management routes, origins, backend pools, regions, subscriptions, tenants, or workloads.
· Increase confidence when Azure Monitor, AKS, Container Apps, App Service, Azure Virtual Machine, application, Defender for Cloud, or SIEM telemetry shows backend-health degradation, autoscaling surge, backend latency, memory pressure, application degradation, user-facing errors, or incident-response evidence in the same service lineage.
· Reduce severity when activity aligns with approved load testing, performance testing, resilience testing, synthetic monitoring, vulnerability scanning, deployment activity, failover, autoscaling, maintenance, security testing, WAF tuning, CDN configuration change, incident-response activity, or emergency mitigation.
· Do not classify Azure Front Door errors, WAF blocks, Application Gateway errors, API Management errors, backend-health changes, autoscaling, AKS restarts, Container Apps restarts, App Service errors, Azure Monitor alerts, or Microsoft Defender for Cloud alerts as probable HTTP/2 exploitation without multi-signal correlation.
· Do not use source IPs, user agents, proof-of-concept names, scanner names, CVE identifiers, or single Azure service events as the primary detection basis.
Required Telemetry
· Azure Front Door logs.
· Azure Web Application Firewall logs.
· Application Gateway logs.
· Azure Load Balancer telemetry where available.
· Azure API Management logs where available.
· NSG Flow Logs where available.
· Azure Monitor metrics.
· Azure Monitor logs.
· Log Analytics workspace data.
· Azure App Service telemetry where available.
· Azure Kubernetes Service telemetry where available.
· Azure Container Apps telemetry where available.
· Azure Virtual Machine telemetry where available.
· Application logs.
· Azure Activity Logs.
· Microsoft Defender for Cloud alerts where available.
· HTTP protocol version where available.
· Source IP.
· Source autonomous system where available.
· Source geolocation where available.
· User agent where available.
· TLS or client fingerprint where available.
· Azure Front Door profile.
· WAF policy.
· WAF rule action.
· Application Gateway listener.
· Application Gateway backend pool.
· API Management route or operation.
· Route.
· Host.
· Origin.
· Backend service.
· AKS namespace.
· AKS service.
· AKS pod.
· Container Apps environment.
· Container Apps service.
· App Service application.
· Azure Virtual Machine.
· Response code.
· Request result.
· Backend status code.
· Backend response time.
· Origin response time where available.
· Request rejection reason where available.
· Protocol-error indicator where available.
· Request count.
· Connection count where available.
· Byte count.
· Memory utilization.
· CPU utilization.
· Autoscaling activity.
· Backend-health state.
· Container restart telemetry where available.
· Pod restart telemetry where available.
· Application error telemetry.
· Azure-hosted service inventory.
· Business-critical route inventory.
· Approved-activity records.
· Change-control records.
· Approved testing records.
· Incident-response records.
Engineering Implementation Instructions
· Build Azure asset groups covering Azure Front Door profiles, Azure WAF policies, Application Gateway listeners, Application Gateway backend pools, API Management routes, AKS services, AKS ingress paths, Container Apps services, App Service applications, Azure Virtual Machine-backed application services, and business-critical Azure-hosted workloads.
· Build service-lineage mappings connecting Azure Front Door profiles, WAF policies, Application Gateway listeners, backend pools, API Management routes, origins, AKS services, Container Apps services, App Service applications, Azure Virtual Machines, routes, tenants, subscriptions, regions, and business applications.
· Build edge-anomaly groups covering elevated request rejection, WAF action spikes, protocol errors, elevated 4xx / 5xx responses, backend response-time growth, origin error increase, gateway timeout increase, backend-health degradation, and abnormal source clustering.
· Build resource-impact groups covering memory pressure, CPU pressure, worker exhaustion, queue growth, AKS pod restart, Container Apps restart, node pressure, container eviction, App Service error increase, out-of-memory behavior, autoscaling surge, application error increase, and user-facing degradation.
· Build approved-activity groups for load testing, performance testing, resilience testing, synthetic monitoring, vulnerability scanning, deployments, failovers, autoscaling, maintenance, security testing, WAF tuning, CDN configuration changes, incident response, and emergency mitigation.
· Validate whether Azure logs and metrics can be joined on Azure Front Door profile, WAF policy, Application Gateway listener, backend pool, origin, API Management route, AKS namespace, AKS service, pod, Container Apps service, App Service application, Azure Virtual Machine, route, timestamp, region, subscription, tenant, and business service.
· Use short correlation windows when edge anomalies and resource pressure occur together on the same service lineage.
· Use moderate correlation windows when resource pressure follows lower-rate edge anomalies.
· Use longer correlation windows only when retained protocol telemetry, incident-response evidence, application-impact telemetry, or workload lineage supports delayed linkage.
· Add severity weighting for business-critical route impact, repeated edge anomalies, distributed source behavior, WAF action spikes, backend-health degradation, memory pressure, container instability, autoscaling surge, application degradation, and absence of approved operational activity.
· Validate log availability, Azure Monitor metric coverage, Azure Activity Log coverage, field mappings, service-lineage mappings, timestamps, time-zone handling, ingestion delay, correlation windows, exception logic, query performance, and false-positive baselines before production deployment.
· Treat Azure correlation output as investigation-ready evidence until local rule performance, field completeness, and SOC triage workflow are validated.
· Do not enable alert mode until Azure log sources, metric sources, field mappings, service-lineage mappings, enrichment, baselines, exceptions, query performance, and SOC triage workflow are validated.
DRI Assessment
DRI
8.1 / 10
· The rule is behaviorally anchored to durable Azure edge, workload, resource-impact, and approved-activity correlation rather than static indicators, CVE identifiers, source IPs, user agents, or proof-of-concept names.
· The rule remains useful if an adversary changes source infrastructure, user agent, request timing, route targeting, Azure Front Door targeting, Application Gateway backend-pool targeting, API Management route targeting, or HTTP/2 abuse variant.
· The score is supported by Azure telemetry correlation across Azure Front Door, WAF, Application Gateway, API Management, Azure Monitor, AKS, Container Apps, App Service, Azure Virtual Machines, application logs, Azure Activity Logs, Defender for Cloud alerts where available, and approved-activity context.
· The score is constrained by incomplete HTTP/2 metadata, CDN normalization, WAF abstraction, Application Gateway field limitations, managed-service visibility gaps, weak service-lineage mapping, and benign operational activity that can produce similar symptoms.
· The rule is durable as an Azure cloud-edge and workload-impact correlation detector but should not be treated as standalone proof of exploitation.
TCR Assessment
Operational TCR
7.4 / 10
Full-Telemetry TCR
8.7 / 10
· Operational confidence depends on accurate Azure Front Door, WAF, Application Gateway, API Management, AKS, Container Apps, App Service, Azure Virtual Machine, Azure Monitor, Azure Activity Log, application-log, service-lineage, and approved-activity telemetry.
· Operational confidence is reduced where HTTP/2 fields are unavailable, Azure Front Door or WAF logs are sampled or delayed, Application Gateway context is incomplete, backend-health data is incomplete, or resource telemetry cannot be tied to affected services.
· Operational confidence is reduced during load testing, synthetic monitoring, vulnerability scanning, deployments, failovers, maintenance, autoscaling, WAF tuning, CDN changes, security testing, incident response, or legitimate traffic surges.
· Full-telemetry confidence improves when Azure edge logs, workload telemetry, Azure Monitor metrics, Azure Activity Logs, application telemetry, AKS telemetry, Container Apps telemetry, Defender for Cloud alerts, and approved-activity records are correlated.
· Even under full telemetry conditions, this rule should support high-confidence escalation only after field validation, timing validation, and false-positive review.
Limitations
· Azure telemetry may not expose full HTTP/2 frame-level behavior or CONTINUATION-frame detail.
· Azure Front Door, WAF, Application Gateway, API Management, and managed-service layers may normalize or abstract protocol behavior.
· Resource telemetry may show pressure without proving HTTP/2 causality.
· Autoscaling, deployment activity, failover, resilience testing, load testing, WAF tuning, CDN changes, security testing, and legitimate traffic growth can produce similar symptoms.
· The rule may miss activity absorbed by Azure Front Door or Azure WAF before reaching origins or workloads.
· The rule may miss low-and-slow activity that degrades service without breaching Azure Monitor, backend-health, or application thresholds.
· The rule should not be used for actor attribution without incident-specific intelligence, validated behavioral correlation, or confirmed victim-environment evidence.
Detection Query Pattern
Azure HTTP/2 edge anomaly and resource-impact correlation query pattern requiring Azure log-source validation, metric-source validation, field mapping, service-lineage validation, timing-window tuning, approved operational allowlisting, and false-positive testing before production deployment. In production, this pattern should be implemented through SIEM correlation, Microsoft Sentinel analytics rules, Azure Monitor alerts, Log Analytics / KQL queries, Event Grid / Event Hub pipelines, Defender for Cloud enrichment, or platform-native detections depending on telemetry architecture.
AzureFrontDoorOrWAFOrAppGatewayEvent AS AzureEdgeAnomaly
WHERE AzureEdgeAnomaly.Service IN ANY (
"Azure Front Door",
"Azure Web Application Firewall",
"Application Gateway",
"Azure API Management",
"Ingress",
"Service Mesh"
)
AND (
AzureEdgeAnomaly.ProtocolVersion IN ANY (
"HTTP/2",
"h2",
"h2c"
)
OR AzureEdgeAnomaly.HTTPVersion IN ANY (
"HTTP/2",
"h2",
"h2c"
)
OR AzureEdgeAnomaly.Service IN ANY (
"Azure Front Door",
"Azure Web Application Firewall",
"Application Gateway",
"Azure API Management"
)
)
AND (
AzureEdgeAnomaly.EventPattern IN ANY (
"request_rejection_spike",
"protocol_error_increase",
"waf_action_spike",
"backend_response_time_growth",
"origin_error_increase",
"gateway_timeout_increase",
"backend_health_degradation",
"source_cluster_anomaly"
)
OR AzureEdgeAnomaly.ResponseCode IN ANY (
400,
413,
431,
502,
503,
504
)
)
AzureMonitorOrWorkloadEvent AS AzureResourceImpact
WHERE AzureResourceImpact.ServiceLineage IN SAME_SERVICE_LINEAGE(AzureEdgeAnomaly.ServiceLineage)
AND AzureResourceImpact.EventPattern IN ANY (
"memory_pressure",
"cpu_pressure",
"worker_exhaustion",
"queue_growth",
"aks_pod_restart",
"container_apps_restart",
"node_pressure",
"container_eviction",
"app_service_error_increase",
"out_of_memory_behavior",
"autoscaling_surge",
"application_error_increase",
"user_facing_degradation"
)
Suppress or downgrade when approved-activity context matches approved load testing, performance testing, resilience testing, synthetic monitoring, vulnerability scanning, deployment, failover, autoscaling, maintenance, WAF tuning, CDN change, security testing, incident response, or emergency mitigation.
Rule
Azure Edge-to-Origin Retry Expansion and Backend-Health Degradation
Rule Format
Azure cloud-edge and origin-impact correlation rule suitable for Azure Front Door logs, Azure WAF logs, Application Gateway logs, Azure API Management logs, Azure Monitor metrics, backend-health telemetry, AKS telemetry, Container Apps telemetry, App Service telemetry, Azure Virtual Machine telemetry, application telemetry, NSG Flow Logs where available, Azure Activity Logs, approved-activity records, route inventory, backend-pool inventory, origin inventory, service-lineage mapping, and SIEM correlation after backend-lineage validation, retry-baseline validation, timing-window tuning, and environment-specific allowlisting.
Detection Purpose
· Detect edge-to-origin retry expansion, timeout growth, backend-health degradation, origin error increase, backend saturation, or route-level degradation affecting Azure-hosted web infrastructure.
· Identify when HTTP/2-facing pressure propagates from Azure Front Door, Azure WAF, Application Gateway, API Management, ingress, or service-mesh layers into origins, backend pools, AKS services, Container Apps services, App Service applications, Azure Virtual Machine-backed workloads, or business-critical application routes.
· Prioritize authentication routes, API routes, payment workflows, customer portals, SaaS front ends, Azure Front Door origins, Application Gateway backend pools, API Management routes, AKS ingress paths, Container Apps services, App Service applications, and high-value application services.
· Support escalation when retry expansion or backend-health degradation aligns with HTTP/2-facing anomalies, source clusters, resource pressure, application errors, autoscaling activity, and absence of approved operational activity.
· Preserve separation between service-impact correlation and confirmed exploitation by requiring supporting protocol, source, resource, route, approved-activity, or incident-response evidence before classifying activity as probable exploitation.
· This rule does not prove HTTP/2 exploitation, memory exhaustion, backend compromise, application compromise, cloud compromise, or actor attribution without supporting telemetry.
Detection Logic
· Identify edge-to-origin, Application Gateway-to-backend, API Management-to-backend, ingress-to-service, or service-mesh-to-backend communication affecting Azure-hosted web infrastructure.
· Prioritize retry expansion, timeout growth, upstream reset increase, connection refusal, backend response-time growth, backend-health degradation, origin error increase, backend saturation, route latency, application error increase, or autoscaling surge.
· Correlate service-impact patterns with related HTTP/2-facing anomalies such as request rejection, WAF action spikes, protocol errors, gateway errors, source clustering, elevated 4xx / 5xx responses, or backend response-time anomalies.
· Increase confidence when route degradation affects business-critical application paths, Azure Front Door origins, Application Gateway backend pools, API Management routes, AKS services, Container Apps services, App Service applications, Azure Virtual Machine-backed workloads, or SaaS front ends.
· Increase confidence when backend pressure aligns with memory pressure, CPU pressure, worker exhaustion, queue growth, AKS pod restart, Container Apps restart, node pressure, container eviction, App Service error increase, autoscaling surge, or application degradation.
· Increase confidence when similar edge-to-origin degradation appears across multiple Azure Front Door profiles, WAF policies, Application Gateways, backend pools, origins, API Management routes, regions, subscriptions, tenants, or business services.
· Reduce severity when activity matches approved load testing, failover, deployment, resilience testing, synthetic monitoring, vulnerability scanning, backend maintenance, WAF change, CDN change, ingress change, service-mesh change, security testing, autoscaling, incident-response activity, or emergency mitigation.
· Do not classify retry expansion, gateway timeouts, route latency, origin errors, backend-health degradation, or autoscaling surge as HTTP/2 exploitation without supporting HTTP/2-facing source, route, resource, or operational-context evidence.
· Do not interpret defensive telemetry export, health-check traffic, autoscaling activity, Azure Monitor alert activity, or mitigation-control activation as adversary-controlled outbound communication without host, process, identity, destination, and incident-response evidence.
Required Telemetry
· Azure Front Door logs.
· Azure Web Application Firewall logs.
· Application Gateway logs.
· Azure API Management logs where available.
· NSG Flow Logs where available.
· Azure Monitor metrics.
· Azure Monitor logs.
· Log Analytics workspace data.
· Backend-health telemetry.
· AKS telemetry where available.
· Container Apps telemetry where available.
· App Service telemetry where available.
· Azure Virtual Machine telemetry where available.
· Application performance telemetry.
· Azure Activity Logs.
· Edge node or profile identifier.
· WAF policy.
· Application Gateway listener.
· Application Gateway backend pool.
· API Management route or operation.
· Origin.
· Backend service.
· Destination service.
· Route.
· Host.
· Response code.
· Backend status code.
· Upstream result where available.
· Connection result where available.
· Retry count where available.
· Timeout count where available.
· Backend response time.
· Origin response time where available.
· Backend-health status.
· Request count.
· Byte count.
· Backend latency.
· Application latency.
· Application error rate.
· Memory utilization.
· CPU utilization.
· Autoscaling activity.
· AKS pod state where available.
· Container Apps state where available.
· App Service state where available.
· Azure Virtual Machine state where available.
· Route-to-service mapping.
· Backend-pool inventory.
· Origin inventory.
· Business-critical route inventory.
· Approved-activity records.
· Change-control records.
· Approved testing records.
· Incident-response records.
Engineering Implementation Instructions
· Build Azure service-lineage maps connecting Azure Front Door profiles, WAF policies, Application Gateway listeners, backend pools, API Management routes, origins, AKS services, Container Apps services, App Service applications, Azure Virtual Machines, routes, tenants, subscriptions, regions, and business applications.
· Build backend groups covering Application Gateway backend pools, AKS services, Container Apps services, App Service applications, Azure Virtual Machine-backed application services, service-mesh upstreams, and business-critical dependencies.
· Build service-impact groups covering retry expansion, timeout growth, upstream reset increase, connection refusal, backend response-time growth, backend-health degradation, origin error increase, backend saturation, route latency, application error increase, and autoscaling surge.
· Build HTTP/2-facing anomaly enrichment for Azure Front Door errors, WAF action spikes, Application Gateway errors, API Management errors, protocol errors, request rejection, source clustering, route sensitivity, backend response-time anomalies, and elevated 4xx / 5xx patterns.
· Build approved-activity groups for load testing, performance testing, resilience testing, synthetic monitoring, vulnerability scanning, deployments, failovers, backend maintenance, WAF change, CDN change, ingress change, service-mesh change, autoscaling, security testing, incident response, and emergency mitigation.
· Validate whether Azure logs and metrics can join on Azure Front Door profile, WAF policy, Application Gateway listener, backend pool, API Management route, origin, AKS namespace, AKS service, pod, Container Apps service, App Service application, Azure Virtual Machine, route, timestamp, region, subscription, tenant, and business service.
· Use short correlation windows when edge-to-origin pressure occurs during active HTTP/2-facing anomaly windows.
· Use moderate correlation windows when backend-health degradation or backend latency follows lower-rate HTTP/2-facing anomalies.
· Use longer correlation windows only when route-to-service lineage, application-impact telemetry, retained edge telemetry, or incident-response evidence supports delayed linkage.
· Add severity weighting for business-critical route impact, repeated retry expansion, backend-health degradation, origin error increase, backend latency, autoscaling surge, resource pressure, and absence of approved operational activity.
· Validate telemetry coverage, field mappings, service-lineage mappings, retry baselines, backend-health baselines, event timestamps, ingestion delay, timing windows, exception logic, query performance, and false-positive baselines before production deployment.
· Treat edge-to-origin retry expansion as a service-impact amplifier, not standalone proof of HTTP/2 exploitation.
· Do not enable alert mode until backend-lineage mapping, retry baselines, backend-health visibility, backend service mapping, enrichment, exceptions, query performance, and SOC triage workflow are validated.
DRI Assessment
DRI
8.0 / 10
· The rule is behaviorally anchored to durable Azure edge-to-origin service-impact propagation rather than static indicators, CVE identifiers, source IPs, user agents, or proof-of-concept names.
· The rule remains useful if an adversary changes source infrastructure, traffic timing, route selection, user agent, Azure Front Door targeting, Application Gateway backend-pool targeting, API Management route targeting, or HTTP/2 behavior mix.
· The score is supported by the durability of retry expansion, timeout growth, backend-health degradation, origin error increase, backend saturation, route latency, autoscaling surge, and application degradation.
· The score is constrained by Azure Front Door abstraction, WAF normalization, Application Gateway field limitations, weak service-lineage mapping, backend dependency noise, deployment activity, failover activity, autoscaling noise, and security testing.
· The rule is durable as an Azure service-impact correlation detector but should not be treated as standalone proof of HTTP/2 exploitation.
TCR Assessment
Operational TCR
7.3 / 10
Full-Telemetry TCR
8.6 / 10
· Operational confidence depends on reliable route-to-service mapping, backend-pool mapping, retry telemetry, backend-health telemetry, origin inventory, backend-service inventory, Azure Monitor metrics, application telemetry, approved-activity records, and SIEM correlation quality.
· Operational confidence is reduced where Azure Front Door, WAF, Application Gateway, API Management, AKS, Container Apps, App Service, Azure Virtual Machine, or application telemetry is sampled, incomplete, delayed, or disconnected from backend service context.
· Operational confidence is reduced during failovers, deployments, traffic shifting, autoscaling events, resilience testing, load testing, synthetic monitoring, vulnerability scanning, backend maintenance, WAF tuning, CDN changes, security testing, or incident response.
· Full-telemetry confidence improves when Azure edge logs, backend-health telemetry, Azure Monitor metrics, workload telemetry, application telemetry, Azure Activity Logs, and approved-activity records are correlated.
· Even under full telemetry conditions, this rule should support service-impact escalation and scoping rather than standalone confirmation of exploitation.
Limitations
· Edge-to-origin retry expansion can be caused by backend dependency failures, deployment regressions, autoscaling delays, failovers, WAF changes, CDN changes, security testing, or normal traffic surges.
· Azure Front Door, WAF, Application Gateway, API Management, and managed-service layers may obscure original source behavior or normalize route-level anomalies.
· Weak service-lineage mapping can reduce confidence in linking edge anomalies to backend impact.
· Azure telemetry may not expose full HTTP/2 frame-level behavior or CONTINUATION-frame details.
· The rule may miss attacks fully absorbed by Azure Front Door or Azure WAF before backend impact occurs.
· The rule may miss low-and-slow activity that degrades service without triggering retry, backend-health, Azure Monitor, or application thresholds.
· The rule should not be used for actor attribution without incident-specific intelligence, validated behavioral correlation, or confirmed victim-environment evidence.
Detection Query Pattern
Azure edge-to-origin retry expansion and backend-health degradation query pattern requiring Azure log-source validation, metric-source validation, service-lineage validation, retry-baseline validation, timing-window tuning, approved operational allowlisting, and false-positive testing before production deployment. In production, this pattern should be implemented through SIEM correlation, Microsoft Sentinel analytics rules, Azure Monitor alerts, Log Analytics / KQL queries, Event Grid / Event Hub pipelines, Defender for Cloud enrichment, or platform-native detections depending on telemetry architecture.
AzureFrontDoorOrAppGatewayOrAPIMEvent AS AzureServiceImpact
WHERE AzureServiceImpact.Service IN ANY (
"Azure Front Door",
"Application Gateway",
"Azure API Management",
"Ingress",
"Service Mesh"
)
AND (
AzureServiceImpact.EventPattern IN ANY (
"retry_expansion",
"timeout_growth",
"upstream_reset_increase",
"connection_refusal_increase",
"backend_response_time_growth",
"backend_health_degradation",
"origin_error_increase",
"backend_saturation",
"route_latency_increase",
"application_error_increase",
"autoscaling_surge"
)
OR AzureServiceImpact.ResponseCode IN ANY (
502,
503,
504
)
)
AzureFrontDoorOrWAFOrAppGatewayEvent AS RelatedHTTP2Anomaly
WHERE RelatedHTTP2Anomaly.ServiceLineage IN SAME_SERVICE_LINEAGE(AzureServiceImpact.ServiceLineage)
AND (
RelatedHTTP2Anomaly.ProtocolVersion IN ANY (
"HTTP/2",
"h2",
"h2c"
)
OR RelatedHTTP2Anomaly.HTTPVersion IN ANY (
"HTTP/2",
"h2",
"h2c"
)
OR RelatedHTTP2Anomaly.Service IN ANY (
"Azure Front Door",
"Azure Web Application Firewall",
"Application Gateway",
"Azure API Management"
)
)
AND RelatedHTTP2Anomaly.EventPattern IN ANY (
"request_rejection_spike",
"protocol_error_increase",
"waf_action_spike",
"source_cluster_anomaly",
"gateway_error_increase",
"backend_response_time_anomaly",
"elevated_4xx",
"elevated_5xx"
)
Suppress or downgrade when approved-activity context matches approved load testing, performance testing, resilience testing, synthetic monitoring, vulnerability scanning, deployment, failover, backend maintenance, WAF change, CDN change, ingress change, service-mesh change, autoscaling, security testing, incident response, or emergency mitigation.
Rule
Azure Business-Critical Route Targeting With Cloud Workload Impact
Rule Format
Azure cloud-edge, route-impact, and workload-impact correlation rule suitable for Azure Front Door logs, Azure WAF logs, Application Gateway logs, Azure API Management logs, Azure Monitor metrics, Azure Monitor logs, AKS telemetry, Container Apps telemetry, App Service telemetry, Azure Virtual Machine telemetry, NSG Flow Logs where available, application telemetry, Azure Activity Logs, Microsoft Defender for Cloud alerts where available, approved-activity records, business-critical route inventory, workload inventory, source enrichment, and SIEM correlation after business-route validation, source-baseline validation, workload-lineage validation, timing-window tuning, and environment-specific allowlisting.
Detection Purpose
· Detect HTTP/2-facing anomaly patterns targeting business-critical Azure-hosted routes where source behavior, response errors, request rejection, WAF actions, backend response-time changes, and workload-impact telemetry indicate resource-exhaustion pressure.
· Identify route-targeted behavior affecting authentication paths, APIs, payment workflows, customer portals, SaaS front ends, Azure Front Door origins, Application Gateway listeners, API Management routes, AKS ingress paths, Container Apps services, App Service applications, or high-value application services.
· Support escalation when route-targeted behavior aligns with source context, response errors, resource pressure, workload instability, application degradation, and absence of approved operational activity.
· Preserve separation between suspicious route targeting and confirmed exploitation by requiring supporting protocol, source, resource, service-impact, approved-activity, or incident-response evidence before classifying activity as probable exploitation.
· This rule does not prove HTTP/2 exploitation, memory exhaustion, application compromise, credential exposure, lateral movement, cloud compromise, deployment compromise, or actor attribution without supporting telemetry.
Detection Logic
· Identify HTTP/2-facing traffic to business-critical Azure-hosted routes, Azure Front Door origins, Application Gateway listeners, backend pools, API Management routes, AKS ingress paths, Container Apps services, App Service applications, or application front ends.
· Prioritize abnormal source clustering, request rejection, WAF action spikes, elevated 400, 413, 431, 502, 503, 504, gateway timeout patterns, backend response-time growth, origin error increase, or route latency increase.
· Correlate route-targeted behavior with source clusters, rare autonomous systems, unusual geographies, hosting providers, proxy networks, unusual user agents, TLS fingerprints where available, client fingerprints where available, or repeated source patterns.
· Increase confidence when affected routes show memory pressure, CPU pressure, worker exhaustion, queue growth, backend-health degradation, AKS pod restart, Container Apps restart, container eviction, App Service error increase, autoscaling surge, application error increase, or user-facing degradation.
· Increase confidence when similar route-targeted behavior appears across multiple Azure Front Door profiles, WAF policies, Application Gateways, API Management routes, origins, regions, subscriptions, tenants, or service tiers.
· Reduce severity when route impact aligns with approved load testing, performance testing, synthetic monitoring, resilience testing, vulnerability scanning, deployment activity, failover, partner integration behavior, WAF tuning, CDN configuration changes, security testing, autoscaling, known traffic growth, or incident-response activity.
· Do not treat route targeting, source novelty, WAF blocks, Azure Front Door errors, Application Gateway errors, API Management errors, backend response-time growth, autoscaling, or route latency as HTTP/2 exploitation without supporting protocol, resource, and operational-context evidence.
· Do not use CVE identifiers, proof-of-concept names, source IPs, user agents, scanner names, or single cloud-service events as the primary detection model.
Required Telemetry
· Azure Front Door logs.
· Azure Web Application Firewall logs.
· Application Gateway logs.
· Azure API Management logs where available.
· NSG Flow Logs where available.
· Azure Monitor metrics.
· Azure Monitor logs.
· Log Analytics workspace data.
· AKS telemetry where available.
· Container Apps telemetry where available.
· App Service telemetry where available.
· Azure Virtual Machine telemetry where available.
· Application performance telemetry.
· Azure Activity Logs.
· Microsoft Defender for Cloud alerts where available.
· HTTP protocol version where available.
· Source IP.
· Source autonomous system where available.
· Source geolocation where available.
· Source network type where available.
· User agent where available.
· TLS or client fingerprint where available.
· Azure Front Door profile.
· WAF policy.
· WAF rule action.
· Application Gateway listener.
· Application Gateway backend pool.
· API Management route or operation.
· Route.
· Host.
· Origin.
· Business service.
· Tenant where available.
· Subscription where available.
· Request count.
· Connection count where available.
· Response code.
· Request result.
· Backend status code.
· Backend response time.
· Origin response time where available.
· Request rejection reason where available.
· Protocol-error indicator where available.
· Request timing.
· Byte count.
· Backend latency.
· Application latency.
· Application error rate.
· Memory utilization.
· CPU utilization.
· Backend-health state.
· Autoscaling telemetry.
· AKS pod state where available.
· Container Apps state where available.
· App Service state where available.
· Business-critical route inventory.
· Azure workload inventory.
· Application ownership inventory.
· Approved route baseline.
· Approved testing records.
· Change-control records.
· Approved-activity records.
· Incident-response records.
Engineering Implementation Instructions
· Build Azure route groups covering authentication paths, API routes, payment workflows, customer portals, SaaS front ends, Azure Front Door origins, Application Gateway listeners, API Management routes, AKS ingress paths, Container Apps services, App Service applications, administrative portals, and high-value application services.
· Build workload-lineage groups connecting Azure Front Door profiles, WAF policies, Application Gateway listeners, backend pools, API Management routes, origins, AKS services, Container Apps services, App Service applications, Azure Virtual Machines, tenants, subscriptions, routes, and business applications.
· Build source-context groups for repeated source clusters, rare autonomous systems, unusual geographies, hosting providers, proxy networks, unusual user agents, unusual TLS fingerprints where available, abnormal client fingerprints where available, and repeated source patterns.
· Build route-baseline fields for normal HTTP/2 request volume, WAF action rate, Azure Front Door error rate, Application Gateway response-code distribution, API Management error rate, backend response time, backend latency, application latency, and transaction-success ratio.
· Build Azure route-anomaly groups for request rejection, WAF action spikes, protocol-error indicators, elevated 4xx / 5xx responses, backend response-time growth, origin error increase, gateway timeout increase, route latency increase, and source clustering.
· Build workload-impact groups for memory pressure, CPU pressure, worker exhaustion, queue growth, backend-health degradation, AKS pod restart, Container Apps restart, container eviction, App Service error increase, autoscaling surge, application error increase, and user-facing degradation.
· Build approved-activity groups for load testing, performance testing, resilience testing, synthetic monitoring, vulnerability scanning, deployments, failovers, partner integrations, WAF tuning, CDN configuration changes, security testing, autoscaling, incident response, approved traffic-growth events, and emergency mitigation.
· Use short correlation windows for intense route-targeted anomalies affecting business-critical services.
· Use moderate correlation windows when route-targeted anomalies are lower-rate but align with workload pressure, source clustering, or service-impact telemetry.
· Use longer correlation windows only when repeated route targeting, retained edge telemetry, incident-response evidence, or application-impact evidence supports delayed linkage.
· Add severity weighting for business-critical route class, authentication impact, API impact, payment workflow impact, customer-facing impact, WAF action spikes, low completion indicators where available, source clustering, workload pressure, service degradation, and absence of approved operational activity.
· Validate Azure log sources, Azure Monitor metrics, Azure Activity Logs, service-lineage mappings, route baselines, timing windows, exception logic, query performance, and false-positive baselines before production deployment.
· Treat business-critical Azure route degradation as a priority amplifier, not standalone proof of HTTP/2 exploitation.
· Do not enable alert mode until business-route inventory, route baselines, protocol fields, source enrichment, workload-impact visibility, exceptions, query performance, and SOC triage workflow are validated.
DRI Assessment
DRI
8.1 / 10
· The rule is behaviorally anchored to durable route-targeted HTTP/2-facing cloud-edge behavior and Azure workload-impact correlation rather than static indicators, CVE identifiers, proof-of-concept names, user agents, or source IPs.
· The rule remains useful if an adversary changes source distribution, traffic rate, user agent, request timing, route sequence, Azure Front Door targeting, Application Gateway backend-pool targeting, API Management route targeting, or HTTP/2 abuse variant.
· The score is supported by the durability of route targeting, source clustering, WAF action spikes, request rejection, response errors, backend response-time growth, backend-health degradation, workload pressure, and route-level impact against business-critical Azure services.
· The score is constrained by legitimate traffic spikes, load testing, synthetic monitoring, vulnerability scanning, security testing, deployments, incomplete route baselines, weak application ownership mapping, managed-service abstraction, and limited HTTP/2 telemetry.
· The rule is durable as an Azure route-impact and workload-impact correlation detector but should not be treated as standalone proof of exploitation or compromise.
TCR Assessment
Operational TCR
7.4 / 10
Full-Telemetry TCR
8.7 / 10
· Operational confidence depends on accurate business-route inventory, HTTP/2 protocol visibility where available, Azure Front Door logging, WAF logging, Application Gateway logging, API Management logging, route baselines, response-code telemetry, source context, Azure Monitor metrics, workload telemetry, application telemetry, and SIEM correlation quality.
· Operational confidence is reduced where route mapping is incomplete, HTTP/2 metadata is unavailable, Azure Front Door or WAF logs are delayed, Application Gateway context is incomplete, API Management logs are incomplete, or application telemetry cannot be tied to route-level impact.
· Operational confidence is reduced during load testing, synthetic monitoring, vulnerability scanning, security testing, deployment activity, failover, traffic growth, partner integration changes, WAF tuning, CDN changes, autoscaling, or application performance incidents.
· Full-telemetry confidence improves when Azure edge logs, Azure Monitor metrics, AKS telemetry, Container Apps telemetry, App Service telemetry, Azure Virtual Machine telemetry, application logs, Azure Activity Logs, Defender for Cloud alerts, and approved-activity records are correlated.
· Even under full telemetry conditions, this rule should support high-priority investigation and exposure scoping rather than standalone confirmation of exploit success.
Limitations
· Business-critical Azure route degradation can result from normal customer traffic, application regressions, backend dependency failures, deployments, failovers, security testing, WAF tuning, CDN changes, autoscaling, or load testing.
· Weak route inventory or application ownership mapping can reduce confidence.
· Azure Front Door, WAF, Application Gateway, API Management, and managed-service layers may mask source behavior or normalize route-level anomalies.
· Azure telemetry may not expose full HTTP/2 frame-level behavior or CONTINUATION-frame detail.
· The rule may miss attacks that affect low-visibility routes or are absorbed by Azure Front Door or Azure WAF before workload impact occurs.
· The rule may miss low-and-slow behavior that degrades service without breaching Azure Monitor, backend-health, or application thresholds.
· The rule should not be used for actor attribution without incident-specific intelligence, validated behavioral correlation, or confirmed victim-environment evidence.
Detection Query Pattern
Azure business-critical route targeting and workload-impact correlation query pattern requiring Azure log-source validation, metric-source validation, route inventory validation, source-enrichment validation, service-lineage validation, timing-window tuning, approved operational allowlisting, and false-positive testing before production deployment. In production, this pattern should be implemented through SIEM correlation, Microsoft Sentinel analytics rules, Azure Monitor alerts, Log Analytics / KQL queries, Event Grid / Event Hub pipelines, Defender for Cloud enrichment, or platform-native detections depending on telemetry architecture.
AzureFrontDoorOrWAFOrAppGatewayOrAPIMEvent AS AzureBusinessRouteAnomaly
WHERE AzureBusinessRouteAnomaly.Route IN ROUTE_GROUP (
"Authentication Routes",
"API Routes",
"Payment Routes",
"Customer Portals",
"SaaS Front Ends",
"Azure Front Door Origins",
"Application Gateway Listener Routes",
"API Management Routes",
"AKS Ingress Routes",
"Container Apps Routes",
"App Service Applications",
"Business Critical Services"
)
AND (
AzureBusinessRouteAnomaly.ProtocolVersion IN ANY (
"HTTP/2",
"h2",
"h2c"
)
OR AzureBusinessRouteAnomaly.HTTPVersion IN ANY (
"HTTP/2",
"h2",
"h2c"
)
OR AzureBusinessRouteAnomaly.Service IN ANY (
"Azure Front Door",
"Azure Web Application Firewall",
"Application Gateway",
"Azure API Management"
)
)
AND (
AzureBusinessRouteAnomaly.EventPattern IN ANY (
"request_rejection_spike",
"waf_action_spike",
"protocol_error_increase",
"backend_response_time_growth",
"origin_error_increase",
"gateway_timeout_increase",
"route_latency_increase",
"source_cluster_anomaly"
)
OR AzureBusinessRouteAnomaly.ResponseCode IN ANY (
400,
413,
431,
502,
503,
504
)
)
AzureMonitorOrWorkloadEvent AS AzureWorkloadImpact
WHERE AzureWorkloadImpact.ServiceLineage IN SAME_SERVICE_LINEAGE(AzureBusinessRouteAnomaly.ServiceLineage)
AND AzureWorkloadImpact.EventPattern IN ANY (
"memory_pressure",
"cpu_pressure",
"worker_exhaustion",
"queue_growth",
"backend_health_degradation",
"aks_pod_restart",
"container_apps_restart",
"container_eviction",
"app_service_error_increase",
"autoscaling_surge",
"application_error_increase",
"user_facing_degradation"
)
Suppress or downgrade when approved-activity context matches approved load testing, performance testing, resilience testing, synthetic monitoring, vulnerability scanning, partner integration, deployment, failover, traffic-growth event, WAF tuning, CDN change, autoscaling, security testing, incident response, or emergency mitigation.
GCP
Detection Viability Assessment
GCP has three rules for this EXP report.
· GCP is viable for detecting cloud-side evidence associated with HTTP/2 header abuse and memory exhaustion across Google Cloud-hosted web infrastructure when Cloud Load Balancing, Cloud Armor, Cloud CDN, API Gateway, Apigee where applicable, Google Kubernetes Engine, Cloud Run, Compute Engine, Cloud Monitoring, Cloud Logging, VPC Flow Logs, Cloud Audit Logs, Security Command Center findings, container telemetry, workload telemetry, application telemetry, service-lineage mapping, route inventory, and approved-activity telemetry can be correlated.
· GCP is strongest when edge, gateway, load-balancer, WAF-equivalent, workload, application, and monitoring events can be correlated with HTTP/2-facing service exposure, route sensitivity, source context, backend service context, backend-health state, resource pressure, autoscaling behavior, and application-impact telemetry.
· GCP can identify suspicious HTTP/2-facing edge behavior, Cloud Armor action spikes, request rejection, gateway errors, backend latency growth, backend-health degradation, origin error increase, GKE pod instability, Cloud Run revision instability, Compute Engine workload pressure, memory pressure, autoscaling surge, and application degradation affecting business-critical routes or services.
· GCP is not a standalone source for confirming HTTP/2 CONTINUATION-frame exploitation, Rapid Reset-style exploitation, memory exhaustion, application compromise, host compromise, cloud compromise, credential exposure, persistence, lateral movement, deployment compromise, or actor attribution without supporting protocol, workload, application, identity, network, endpoint, or incident-response evidence.
· GCP detections must avoid treating Cloud Load Balancing errors, Cloud Armor denies, Cloud CDN errors, API Gateway errors, Apigee errors, backend-health changes, GKE restarts, Cloud Run revision instability, Compute Engine workload errors, Cloud Monitoring alerts, Security Command Center findings, autoscaling events, or memory-pressure events as confirmed exploitation by themselves.
· GCP detections should support downstream exposure scoping, service-impact triage, cloud containment prioritization, affected-route review, workload-health review, application-impact assessment, and infrastructure recovery prioritization when suspicious HTTP/2-facing behavior aligns with backend or workload impact.
· GCP rules should not generate high-confidence alerting from a single GCP event unless the activity is correlated with suspicious HTTP/2-facing edge behavior, source behavior, route sensitivity, backend pressure, workload instability, application degradation, approved-activity context, or incident-response evidence.
Rule
GCP HTTP/2 Edge Anomaly With Backend Resource and Service-Impact Correlation
Rule Format
GCP cloud-edge and workload-impact correlation rule suitable for Cloud Load Balancing logs, Cloud Armor logs, Cloud CDN logs where available, API Gateway logs, Apigee logs where applicable, VPC Flow Logs where available, Cloud Monitoring metrics, Cloud Logging, Google Kubernetes Engine telemetry, Cloud Run telemetry, Compute Engine telemetry, application logs, Cloud Audit Logs, Security Command Center findings where available, approved-activity records, route inventory, asset inventory, service-lineage mapping, and SIEM correlation after project mapping, service mapping, route mapping, source-network validation, timing-window tuning, and environment-specific allowlisting.
Detection Purpose
· Detect HTTP/2-facing edge anomalies that align with backend resource pressure, workload instability, or service degradation across GCP-hosted web infrastructure.
· Identify suspicious Cloud Load Balancing, Cloud Armor, Cloud CDN, API Gateway, Apigee, ingress, service-mesh, GKE, Cloud Run, Compute Engine, or application behavior involving request rejection, protocol errors, elevated 4xx / 5xx responses, backend latency growth, backend-health degradation, memory pressure, worker exhaustion, pod instability, container instability, or application degradation.
· Prioritize GCP-hosted authentication paths, API routes, customer portals, payment workflows, SaaS front ends, load-balancer backend services, Cloud CDN origins, API Gateway routes, Apigee proxies, GKE ingress paths, Cloud Run services, Compute Engine-backed applications, and business-critical workloads.
· Support escalation when edge anomalies align with abnormal source behavior, route sensitivity, backend pressure, workload instability, application impact, and absence of approved operational activity.
· Preserve separation between suspicious GCP-side behavior and confirmed exploitation by requiring protocol, source, route, backend, workload, application, approved-activity, or incident-response evidence before classifying activity as probable exploitation.
· This rule does not prove HTTP/2 exploitation, memory exhaustion, application compromise, host compromise, cloud compromise, credential exposure, persistence, lateral movement, deployment compromise, or actor attribution without supporting telemetry.
Detection Logic
· Identify HTTP/2-facing traffic and service events from Cloud Load Balancing, Cloud Armor, Cloud CDN, API Gateway, Apigee, ingress, service-mesh, GKE, Cloud Run, Compute Engine, or application front ends.
· Prioritize events showing elevated protocol errors, request rejection, Cloud Armor deny or challenge spikes, elevated 400, 413, 431, 502, 503, 504 responses, client disconnect patterns where available, backend latency growth, origin error increase, gateway timeout patterns, or backend-health degradation.
· Correlate edge anomalies with resource-impact or workload-impact events involving memory pressure, CPU pressure, worker exhaustion, queue growth, process restart, service restart, GKE pod restart, Cloud Run revision instability, node pressure, container eviction, Compute Engine application error increase, out-of-memory behavior, autoscaling surge, or application error increase.
· Increase confidence when affected services support authentication paths, API routes, payment workflows, customer portals, SaaS front ends, load-balancer backend services, Cloud CDN origins, API Gateway routes, Apigee proxies, GKE ingress paths, Cloud Run services, Compute Engine-backed applications, or other business-critical workloads.
· Increase confidence when source clusters, autonomous systems, geographies, user agents, TLS fingerprints where available, client fingerprints where available, or proxy paths generate similar HTTP/2-facing anomaly patterns across multiple load balancers, forwarding rules, Cloud Armor policies, backend services, API routes, origins, regions, projects, tenants, or workloads.
· Increase confidence when Cloud Monitoring, GKE, Cloud Run, Compute Engine, application, Security Command Center, or SIEM telemetry shows backend-health degradation, autoscaling surge, backend latency, memory pressure, application degradation, user-facing errors, or incident-response evidence in the same service lineage.
· Reduce severity when activity aligns with approved load testing, performance testing, resilience testing, synthetic monitoring, vulnerability scanning, deployment activity, failover, autoscaling, maintenance, security testing, Cloud Armor tuning, CDN configuration change, incident-response activity, or emergency mitigation.
· Do not classify Cloud Load Balancing errors, Cloud Armor denies, Cloud CDN errors, API Gateway errors, Apigee errors, backend-health changes, autoscaling, GKE restarts, Cloud Run instability, Compute Engine workload errors, Cloud Monitoring alerts, or Security Command Center findings as probable HTTP/2 exploitation without multi-signal correlation.
· Do not use source IPs, user agents, proof-of-concept names, scanner names, CVE identifiers, or single GCP service events as the primary detection basis.
Required Telemetry
· Cloud Load Balancing logs.
· Cloud Armor logs.
· Cloud CDN logs where available.
· API Gateway logs where available.
· Apigee logs where applicable.
· VPC Flow Logs where available.
· Cloud Monitoring metrics.
· Cloud Monitoring logs where available.
· Cloud Logging.
· Google Kubernetes Engine telemetry where available.
· Cloud Run telemetry where available.
· Compute Engine telemetry where available.
· Application logs.
· Cloud Audit Logs.
· Security Command Center findings where available.
· HTTP protocol version where available.
· Source IP.
· Source autonomous system where available.
· Source geolocation where available.
· User agent where available.
· TLS or client fingerprint where available.
· Load balancer.
· Forwarding rule.
· URL map.
· Target proxy.
· Backend service.
· Backend bucket where applicable.
· Cloud Armor policy.
· Cloud Armor rule action.
· API Gateway route.
· Apigee proxy where applicable.
· Route.
· Host.
· Origin.
· Backend service lineage.
· GKE namespace.
· GKE service.
· GKE pod.
· Cloud Run service.
· Cloud Run revision.
· Compute Engine instance.
· Response code.
· Request result.
· Backend status code.
· Backend latency.
· Origin response time where available.
· Request rejection reason where available.
· Protocol-error indicator where available.
· Request count.
· Connection count where available.
· Byte count.
· Memory utilization.
· CPU utilization.
· Autoscaling activity.
· Backend-health state.
· Container restart telemetry where available.
· Pod restart telemetry where available.
· Application error telemetry.
· GCP-hosted service inventory.
· Business-critical route inventory.
· Approved-activity records.
· Change-control records.
· Approved testing records.
· Incident-response records.
Engineering Implementation Instructions
· Build GCP asset groups for external HTTP(S) load balancers, Cloud Armor policies, Cloud CDN configurations, API Gateway routes, Apigee proxies, GKE services, GKE ingress paths, Cloud Run services, Compute Engine-backed application services, and business-critical GCP-hosted workloads.
· Build service-lineage mappings connecting load balancers, forwarding rules, URL maps, target proxies, backend services, backend buckets, Cloud Armor policies, API Gateway routes, Apigee proxies, origins, GKE services, Cloud Run services, Compute Engine instances, routes, tenants, projects, regions, and business applications.
· Build edge-anomaly groups for elevated request rejection, Cloud Armor deny or challenge spikes, protocol errors, elevated 4xx / 5xx responses, backend latency growth, origin error increase, gateway timeout increase, backend-health degradation, and abnormal source clustering.
· Build resource-impact groups for memory pressure, CPU pressure, worker exhaustion, queue growth, GKE pod restart, Cloud Run revision instability, node pressure, container eviction, Compute Engine application error increase, out-of-memory behavior, autoscaling surge, application error increase, and user-facing degradation.
· Build approved-activity groups for load testing, performance testing, resilience testing, synthetic monitoring, vulnerability scanning, deployments, failovers, autoscaling, maintenance, security testing, Cloud Armor tuning, CDN configuration changes, incident response, and emergency mitigation.
· Validate whether GCP logs and metrics can be joined on load balancer, forwarding rule, URL map, target proxy, backend service, backend bucket, Cloud Armor policy, API Gateway route, Apigee proxy, GKE namespace, GKE service, pod, Cloud Run service, Cloud Run revision, Compute Engine instance, route, timestamp, region, project, and business service.
· Use short correlation windows when edge anomalies and resource pressure occur together on the same service lineage.
· Use moderate correlation windows when resource pressure follows lower-rate edge anomalies.
· Use longer correlation windows only when retained protocol telemetry, incident-response evidence, application-impact telemetry, or workload lineage supports delayed linkage.
· Add severity weighting for business-critical route impact, repeated edge anomalies, distributed source behavior, Cloud Armor action spikes, backend-health degradation, memory pressure, container instability, autoscaling surge, application degradation, and absence of approved operational activity.
· Validate log availability, Cloud Monitoring metric coverage, Cloud Audit Log coverage, field mappings, service-lineage mappings, timestamps, time-zone handling, ingestion delay, correlation windows, exception logic, query performance, and false-positive baselines before production deployment.
· Treat GCP correlation output as investigation-ready evidence until local rule performance, field completeness, and SOC triage workflow are validated.
· Do not enable alert mode until GCP log sources, metric sources, field mappings, service-lineage mappings, enrichment, baselines, exceptions, query performance, SOC triage workflow, and incident-response evidence requirements are validated.
DRI Assessment
DRI
8.1 / 10
· The rule is behaviorally anchored to durable GCP edge, workload, resource-impact, and approved-activity correlation rather than static indicators, CVE identifiers, source IPs, user agents, or proof-of-concept names.
· The rule remains useful if an adversary changes source infrastructure, user agent, request timing, route targeting, load-balancer targeting, backend-service targeting, API route targeting, traffic distribution, or HTTP/2 abuse variant.
· The score is supported by the durability of edge anomalies, Cloud Armor action spikes, request rejection, backend latency growth, backend-health degradation, source clustering, memory pressure, autoscaling surge, workload instability, and application degradation.
· The score is constrained by incomplete HTTP/2 metadata, load-balancer normalization, Cloud Armor abstraction, managed-service visibility gaps, weak service-lineage mapping, limited route inventory, legitimate operational activity, and incomplete application-impact telemetry.
· The rule is durable as GCP cloud-edge and workload-impact coverage but should not be treated as standalone proof of HTTP/2 exploitation, memory exhaustion, GCP compromise, workload compromise, or actor attribution.
TCR Assessment
Operational TCR
7.4 / 10
Full-Telemetry TCR
8.7 / 10
· Operational confidence depends on accurate Cloud Load Balancing, Cloud Armor, Cloud CDN, API Gateway, Apigee, GKE, Cloud Run, Compute Engine, Cloud Monitoring, Cloud Audit Log, application-log, service-lineage, route-inventory, and approved-activity telemetry.
· Operational confidence is reduced where HTTP/2 fields are unavailable, load-balancer or Cloud Armor logs are sampled or delayed, backend-health data is incomplete, managed-service telemetry is incomplete, resource telemetry cannot be tied to affected services, or business-route mapping is weak.
· Operational confidence is reduced during load testing, synthetic monitoring, vulnerability scanning, deployments, failovers, maintenance, autoscaling, Cloud Armor tuning, CDN changes, security testing, incident response, emergency mitigation, or legitimate traffic surges.
· Full-telemetry confidence improves when GCP edge logs, workload telemetry, Cloud Monitoring metrics, Cloud Audit Logs, application telemetry, GKE telemetry, Cloud Run telemetry, Compute Engine telemetry, Security Command Center findings, and approved-activity records are correlated.
· Even under full telemetry conditions, this rule should support service-impact escalation and exposure scoping rather than standalone confirmation of exploit success.
Limitations
· GCP telemetry may not expose full HTTP/2 frame-level behavior or CONTINUATION-frame detail.
· Cloud Load Balancing, Cloud Armor, Cloud CDN, API Gateway, Apigee, and managed-service layers may normalize or abstract protocol behavior.
· Resource telemetry may show pressure without proving HTTP/2 causality.
· Autoscaling, deployment activity, failover, resilience testing, load testing, Cloud Armor tuning, CDN changes, security testing, and legitimate traffic growth can produce similar symptoms.
· The rule may miss activity absorbed by Cloud Armor, Cloud CDN, or Cloud Load Balancing before reaching origins or workloads.
· The rule may miss low-and-slow activity that degrades service without breaching Cloud Monitoring, backend-health, or application thresholds.
· The rule should not be used for actor attribution without incident-specific intelligence, validated behavioral correlation, or confirmed victim-environment evidence.
Detection Query Pattern
GCP HTTP/2 edge anomaly and resource-impact correlation query pattern requiring GCP log-source validation, metric-source validation, field mapping, service-lineage validation, timing-window tuning, approved operational allowlisting, and false-positive testing before production deployment. In production, this pattern should be implemented through SIEM correlation, Chronicle detections, Cloud Monitoring alerts, Cloud Logging queries, BigQuery / Log Router pipelines, Security Command Center enrichment, or platform-native detections depending on telemetry architecture.
GCPLoadBalancerOrArmorOrGatewayEvent AS GCPEdgeAnomaly
WHERE GCPEdgeAnomaly.Service IN ANY (
"Cloud Load Balancing",
"Cloud Armor",
"Cloud CDN",
"API Gateway",
"Apigee",
"Ingress",
"Service Mesh"
)
AND (
GCPEdgeAnomaly.ProtocolVersion IN ANY (
"HTTP/2",
"h2",
"h2c"
)
OR GCPEdgeAnomaly.HTTPVersion IN ANY (
"HTTP/2",
"h2",
"h2c"
)
OR GCPEdgeAnomaly.Service IN ANY (
"Cloud Load Balancing",
"Cloud Armor",
"Cloud CDN",
"API Gateway",
"Apigee"
)
)
AND (
GCPEdgeAnomaly.EventPattern IN ANY (
"request_rejection_spike",
"protocol_error_increase",
"cloud_armor_action_spike",
"backend_latency_growth",
"origin_error_increase",
"gateway_timeout_increase",
"backend_health_degradation",
"source_cluster_anomaly"
)
OR GCPEdgeAnomaly.ResponseCode IN ANY (
400,
413,
431,
502,
503,
504
)
)
AND OPTIONAL_CONFIDENCE_INCREASE WITHIN ENV_GCP_RESOURCE_IMPACT_WINDOW (
CloudMonitoringOrWorkloadEvent AS GCPResourceImpact
WHERE GCPResourceImpact.ServiceLineage IN SAME_SERVICE_LINEAGE(GCPEdgeAnomaly.ServiceLineage)
AND GCPResourceImpact.EventPattern IN (
"memory_pressure",
"cpu_pressure",
"worker_exhaustion",
"queue_growth",
"gke_pod_restart",
"cloud_run_revision_instability",
"node_pressure",
"container_eviction",
"compute_engine_application_error_increase",
"out_of_memory_behavior",
"autoscaling_surge",
"application_error_increase",
"user_facing_degradation"
)
)
AND NOT ChangeContext IN (
"approved_load_testing",
"approved_performance_testing",
"approved_resilience_testing",
"approved_synthetic_monitoring",
"approved_vulnerability_scanning",
"approved_deployment",
"approved_failover",
"approved_autoscaling",
"approved_maintenance",
"approved_cloud_armor_tuning",
"approved_cdn_change",
"approved_security_testing",
"approved_incident_response",
"approved_emergency_mitigation"
)
Rule
GCP Edge-to-Origin Retry Expansion and Backend-Health Degradation
Rule Format
GCP cloud-edge and origin-impact correlation rule suitable for Cloud Load Balancing logs, Cloud Armor logs, Cloud CDN logs where available, API Gateway logs, Apigee logs where applicable, Cloud Monitoring metrics, backend-health telemetry, GKE telemetry, Cloud Run telemetry, Compute Engine telemetry, application telemetry, VPC Flow Logs where available, Cloud Audit Logs, approved-activity records, route inventory, backend-service inventory, origin inventory, service-lineage mapping, and SIEM correlation after backend-lineage validation, retry-baseline validation, timing-window tuning, and environment-specific allowlisting.
Detection Purpose
· Detect edge-to-origin retry expansion, timeout growth, backend-health degradation, origin error increase, backend saturation, or route-level degradation affecting GCP-hosted web infrastructure.
· Identify when HTTP/2-facing pressure propagates from Cloud Load Balancing, Cloud Armor, Cloud CDN, API Gateway, Apigee, ingress, or service-mesh layers into origins, backend services, GKE services, Cloud Run services, Compute Engine-backed workloads, or business-critical application routes.
· Prioritize authentication routes, API routes, payment workflows, customer portals, SaaS front ends, load-balancer backend services, Cloud CDN origins, API Gateway routes, Apigee proxies, GKE ingress paths, Cloud Run services, and high-value application services.
· Support escalation when retry expansion or backend-health degradation aligns with HTTP/2-facing anomalies, source clusters, resource pressure, application errors, autoscaling activity, and absence of approved operational activity.
· Preserve separation between service-impact correlation and confirmed exploitation by requiring supporting protocol, source, resource, route, approved-activity, or incident-response evidence before classifying activity as probable exploitation.
· This rule does not prove HTTP/2 exploitation, memory exhaustion, backend compromise, application compromise, cloud compromise, or actor attribution without supporting telemetry.
Detection Logic
· Identify edge-to-origin, load-balancer-to-backend, API Gateway-to-backend, Apigee-to-backend, ingress-to-service, or service-mesh-to-backend communication affecting GCP-hosted web infrastructure.
· Prioritize retry expansion, timeout growth, upstream reset increase, connection refusal, backend latency growth, backend-health degradation, origin error increase, backend saturation, route latency, application error increase, or autoscaling surge.
· Correlate service-impact patterns with related HTTP/2-facing anomalies such as request rejection, Cloud Armor action spikes, protocol errors, gateway errors, source clustering, elevated 4xx / 5xx responses, or backend latency anomalies.
· Increase confidence when route degradation affects business-critical application paths, load-balancer backend services, Cloud CDN origins, API Gateway routes, Apigee proxies, GKE services, Cloud Run services, Compute Engine-backed workloads, or SaaS front ends.
· Increase confidence when backend pressure aligns with memory pressure, CPU pressure, worker exhaustion, queue growth, GKE pod restart, Cloud Run revision instability, node pressure, container eviction, Compute Engine application error increase, autoscaling surge, or application degradation.
· Increase confidence when similar edge-to-origin degradation appears across multiple load balancers, forwarding rules, Cloud Armor policies, backend services, origins, API Gateway routes, Apigee proxies, regions, projects, tenants, or business services.
· Reduce severity when activity matches approved load testing, failover, deployment, resilience testing, synthetic monitoring, vulnerability scanning, backend maintenance, Cloud Armor change, CDN change, ingress change, service-mesh change, security testing, autoscaling, incident-response activity, or emergency mitigation.
· Do not classify retry expansion, gateway timeouts, route latency, origin errors, backend-health degradation, or autoscaling surge as HTTP/2 exploitation without supporting HTTP/2-facing source, route, resource, or operational-context evidence.
· Do not interpret defensive telemetry export, health-check traffic, autoscaling activity, Cloud Monitoring alert activity, or mitigation-control activation as adversary-controlled outbound communication without host, process, identity, destination, and incident-response evidence.
Required Telemetry
· Cloud Load Balancing logs.
· Cloud Armor logs.
· Cloud CDN logs where available.
· API Gateway logs where available.
· Apigee logs where applicable.
· VPC Flow Logs where available.
· Cloud Monitoring metrics.
· Cloud Monitoring logs where available.
· Cloud Logging.
· Backend-health telemetry.
· Google Kubernetes Engine telemetry where available.
· Cloud Run telemetry where available.
· Compute Engine telemetry where available.
· Application performance telemetry.
· Cloud Audit Logs.
· Edge node or load-balancer identifier.
· Forwarding rule.
· URL map.
· Target proxy.
· Backend service.
· Backend bucket where applicable.
· Cloud Armor policy.
· API Gateway route.
· Apigee proxy where applicable.
· Origin.
· Backend service lineage.
· Destination service.
· Route.
· Host.
· Response code.
· Backend status code.
· Upstream result where available.
· Connection result where available.
· Retry count where available.
· Timeout count where available.
· Backend latency.
· Origin response time where available.
· Backend-health status.
· Request count.
· Byte count.
· Application latency.
· Application error rate.
· Memory utilization.
· CPU utilization.
· Autoscaling activity.
· GKE pod state where available.
· Cloud Run revision state where available.
· Compute Engine state where available.
· Route-to-service mapping.
· Backend-service inventory.
· Origin inventory.
· Business-critical route inventory.
· Approved-activity records.
· Change-control records.
· Approved testing records.
· Incident-response records.
Engineering Implementation Instructions
· Build GCP service-lineage maps connecting load balancers, forwarding rules, URL maps, target proxies, backend services, backend buckets, Cloud Armor policies, API Gateway routes, Apigee proxies, origins, GKE services, Cloud Run services, Compute Engine instances, routes, tenants, projects, regions, and business applications.
· Build backend groups covering load-balancer backend services, GKE services, Cloud Run services, Compute Engine-backed application services, service-mesh upstreams, and business-critical dependencies.
· Build service-impact groups covering retry expansion, timeout growth, upstream reset increase, connection refusal, backend latency growth, backend-health degradation, origin error increase, backend saturation, route latency, application error increase, and autoscaling surge.
· Build HTTP/2-facing anomaly enrichment for Cloud Load Balancing errors, Cloud Armor action spikes, Cloud CDN errors, API Gateway errors, Apigee errors, protocol errors, request rejection, source clustering, route sensitivity, backend latency anomalies, and elevated 4xx / 5xx patterns.
· Build approved-activity groups for load testing, performance testing, resilience testing, synthetic monitoring, vulnerability scanning, deployments, failovers, backend maintenance, Cloud Armor change, CDN change, ingress change, service-mesh change, autoscaling, security testing, incident response, and emergency mitigation.
· Validate whether GCP logs and metrics can join on load balancer, forwarding rule, URL map, target proxy, backend service, backend bucket, Cloud Armor policy, API Gateway route, Apigee proxy, origin, GKE namespace, GKE service, pod, Cloud Run service, revision, Compute Engine instance, route, timestamp, region, project, and business service.
· Use short correlation windows when edge-to-origin pressure occurs during active HTTP/2-facing anomaly windows.
· Use moderate correlation windows when backend-health degradation or backend latency follows lower-rate HTTP/2-facing anomalies.
· Use longer correlation windows only when route-to-service lineage, application-impact telemetry, retained edge telemetry, or incident-response evidence supports delayed linkage.
· Add severity weighting for business-critical route impact, repeated retry expansion, backend-health degradation, origin error increase, backend latency, autoscaling surge, resource pressure, and absence of approved operational activity.
· Validate telemetry coverage, field mappings, service-lineage mappings, retry baselines, backend-health baselines, event timestamps, ingestion delay, timing windows, exception logic, query performance, and false-positive baselines before production deployment.
· Treat edge-to-origin retry expansion as a service-impact amplifier, not standalone proof of HTTP/2 exploitation.
· Do not enable alert mode until backend-lineage mapping, retry baselines, backend-health visibility, backend service mapping, enrichment, exceptions, query performance, SOC triage workflow, and incident-response evidence requirements are validated.
DRI Assessment
DRI
8.0 / 10
· The rule is behaviorally anchored to durable GCP edge-to-origin service-impact propagation rather than static indicators, CVE identifiers, source IPs, user agents, or proof-of-concept names.
· The rule remains useful if an adversary changes source infrastructure, traffic timing, route selection, user agent, load-balancer targeting, backend-service targeting, API route targeting, or HTTP/2 behavior mix.
· The score is supported by the durability of retry expansion, timeout growth, backend-health degradation, origin error increase, backend saturation, route latency, autoscaling surge, resource pressure, and application degradation.
· The score is constrained by load-balancer abstraction, Cloud Armor normalization, weak service-lineage mapping, backend dependency noise, deployment activity, failover activity, autoscaling noise, security testing, incomplete retry telemetry, and incomplete backend-health baselines.
· The rule is durable as GCP service-impact coverage but should not be treated as standalone proof of HTTP/2 exploitation, memory exhaustion, backend compromise, cloud compromise, or actor attribution.
TCR Assessment
Operational TCR
7.3 / 10
Full-Telemetry TCR
8.6 / 10
· Operational confidence depends on reliable route-to-service mapping, backend-service mapping, retry telemetry, backend-health telemetry, origin inventory, backend-service inventory, Cloud Monitoring metrics, application telemetry, approved-activity records, and SIEM correlation quality.
· Operational confidence is reduced where Cloud Load Balancing, Cloud Armor, Cloud CDN, API Gateway, Apigee, GKE, Cloud Run, Compute Engine, or application telemetry is sampled, incomplete, delayed, or disconnected from backend service context.
· Operational confidence is reduced during failovers, deployments, traffic shifting, autoscaling events, resilience testing, load testing, synthetic monitoring, vulnerability scanning, backend maintenance, Cloud Armor tuning, CDN changes, security testing, incident response, or emergency mitigation.
· Full-telemetry confidence improves when GCP edge logs, backend-health telemetry, Cloud Monitoring metrics, workload telemetry, application telemetry, Cloud Audit Logs, and approved-activity records are correlated.
· Even under full telemetry conditions, this rule should support service-impact escalation and scoping rather than standalone confirmation of exploitation.
Limitations
· Edge-to-origin retry expansion can be caused by backend dependency failures, deployment regressions, autoscaling delays, failovers, Cloud Armor changes, CDN changes, security testing, or normal traffic surges.
· Cloud Load Balancing, Cloud Armor, Cloud CDN, API Gateway, Apigee, and managed-service layers may obscure original source behavior or normalize route-level anomalies.
· Weak service-lineage mapping can reduce confidence in linking edge anomalies to backend impact.
· GCP telemetry may not expose full HTTP/2 frame-level behavior or CONTINUATION-frame details.
· The rule may miss attacks fully absorbed by Cloud Armor, Cloud CDN, or Cloud Load Balancing before backend impact occurs.
· The rule may miss low-and-slow activity that degrades service without triggering retry, backend-health, Cloud Monitoring, or application thresholds.
· The rule should not be used for actor attribution without incident-specific intelligence, validated behavioral correlation, or confirmed victim-environment evidence.
Detection Query Pattern
GCP edge-to-origin retry expansion and backend-health degradation query pattern requiring GCP log-source validation, metric-source validation, service-lineage validation, retry-baseline validation, timing-window tuning, approved operational allowlisting, and false-positive testing before production deployment. In production, this pattern should be implemented through SIEM correlation, Chronicle detections, Cloud Monitoring alerts, Cloud Logging queries, BigQuery / Log Router pipelines, Security Command Center enrichment, or platform-native detections depending on telemetry architecture.
GCPLoadBalancerOrGatewayEvent AS GCPServiceImpact
WHERE GCPServiceImpact.Service IN ANY (
"Cloud Load Balancing",
"Cloud CDN",
"API Gateway",
"Apigee",
"Ingress",
"Service Mesh"
)
AND (
GCPServiceImpact.EventPattern IN ANY (
"retry_expansion",
"timeout_growth",
"upstream_reset_increase",
"connection_refusal_increase",
"backend_latency_growth",
"backend_health_degradation",
"origin_error_increase",
"backend_saturation",
"route_latency_increase",
"application_error_increase",
"autoscaling_surge"
)
OR GCPServiceImpact.ResponseCode IN ANY (
502,
503,
504
)
)
AND OPTIONAL_CONFIDENCE_INCREASE WITHIN ENV_GCP_HTTP2_EDGE_CONTEXT_WINDOW (
GCPLoadBalancerOrArmorOrGatewayEvent AS RelatedHTTP2Anomaly
WHERE RelatedHTTP2Anomaly.ServiceLineage IN SAME_SERVICE_LINEAGE(GCPServiceImpact.ServiceLineage)
AND (
RelatedHTTP2Anomaly.ProtocolVersion IN ANY (
"HTTP/2",
"h2",
"h2c"
)
OR RelatedHTTP2Anomaly.HTTPVersion IN ANY (
"HTTP/2",
"h2",
"h2c"
)
OR RelatedHTTP2Anomaly.Service IN ANY (
"Cloud Load Balancing",
"Cloud Armor",
"Cloud CDN",
"API Gateway",
"Apigee"
)
)
AND RelatedHTTP2Anomaly.EventPattern IN (
"request_rejection_spike",
"protocol_error_increase",
"cloud_armor_action_spike",
"source_cluster_anomaly",
"gateway_error_increase",
"backend_latency_anomaly",
"elevated_4xx",
"elevated_5xx"
)
)
AND NOT ChangeContext IN (
"approved_load_testing",
"approved_performance_testing",
"approved_resilience_testing",
"approved_synthetic_monitoring",
"approved_vulnerability_scanning",
"approved_deployment",
"approved_failover",
"approved_backend_maintenance",
"approved_cloud_armor_change",
"approved_cdn_change",
"approved_ingress_change",
"approved_service_mesh_change",
"approved_autoscaling",
"approved_security_testing",
"approved_incident_response",
"approved_emergency_mitigation"
)
Rule
GCP Business-Critical Route Targeting With Cloud Workload Impact
Rule Format
GCP cloud-edge, route-impact, and workload-impact correlation rule suitable for Cloud Load Balancing logs, Cloud Armor logs, Cloud CDN logs where available, API Gateway logs, Apigee logs where applicable, Cloud Monitoring metrics, Cloud Logging, GKE telemetry, Cloud Run telemetry, Compute Engine telemetry, VPC Flow Logs where available, application telemetry, Cloud Audit Logs, Security Command Center findings where available, approved-activity records, business-critical route inventory, workload inventory, source enrichment, service-lineage mapping, and SIEM correlation after business-route validation, source-baseline validation, workload-lineage validation, timing-window tuning, and environment-specific allowlisting.
Detection Purpose
· Detect HTTP/2-facing anomaly patterns targeting business-critical GCP-hosted routes where source behavior, response errors, request rejection, Cloud Armor actions, backend latency changes, and workload-impact telemetry indicate resource-exhaustion pressure.
· Identify route-targeted behavior affecting authentication paths, APIs, payment workflows, customer portals, SaaS front ends, Cloud Load Balancing backend services, Cloud CDN origins, API Gateway routes, Apigee proxies, GKE ingress paths, Cloud Run services, Compute Engine-backed applications, administrative portals, or high-value application services.
· Support escalation when route-targeted behavior aligns with source context, response errors, resource pressure, workload instability, application degradation, and absence of approved operational activity.
· Preserve separation between suspicious route targeting and confirmed exploitation by requiring supporting protocol, source, resource, service-impact, approved-activity, or incident-response evidence before classifying activity as probable exploitation.
· This rule does not prove HTTP/2 exploitation, memory exhaustion, application compromise, credential exposure, lateral movement, cloud compromise, deployment compromise, or actor attribution without supporting telemetry.
Detection Logic
· Identify HTTP/2-facing traffic to business-critical GCP-hosted routes, Cloud Load Balancing backend services, Cloud CDN origins, API Gateway routes, Apigee proxies, GKE ingress paths, Cloud Run services, Compute Engine-backed applications, administrative portals, or application front ends.
· Prioritize abnormal source clustering, request rejection, Cloud Armor action spikes, elevated 400, 413, 431, 502, 503, 504 responses, gateway timeout patterns, backend latency growth, origin error increase, route latency increase, or low completion indicators where available.
· Correlate route-targeted behavior with source clusters, rare autonomous systems, unusual geographies, hosting providers, proxy networks, unusual user agents, TLS fingerprints where available, client fingerprints where available, or repeated source patterns.
· Increase confidence when affected routes show memory pressure, CPU pressure, worker exhaustion, queue growth, backend-health degradation, GKE pod restart, Cloud Run revision instability, container eviction, Compute Engine application error increase, autoscaling surge, application error increase, or user-facing degradation.
· Increase confidence when similar route-targeted behavior appears across multiple load balancers, forwarding rules, Cloud Armor policies, API Gateway routes, Apigee proxies, origins, regions, projects, tenants, or service tiers.
· Reduce severity when route impact aligns with approved load testing, performance testing, synthetic monitoring, resilience testing, vulnerability scanning, deployment activity, failover, partner integration behavior, Cloud Armor tuning, CDN configuration changes, security testing, autoscaling, known traffic growth, incident-response activity, or emergency mitigation.
· Do not treat route targeting, source novelty, Cloud Armor denies, load-balancer errors, Cloud CDN errors, API Gateway errors, Apigee errors, backend latency growth, autoscaling, or route latency as HTTP/2 exploitation without supporting protocol, resource, and operational-context evidence.
· Do not use CVE identifiers, proof-of-concept names, source IPs, user agents, scanner names, or single cloud-service events as the primary detection model.
Required Telemetry
· Cloud Load Balancing logs.
· Cloud Armor logs.
· Cloud CDN logs where available.
· API Gateway logs where available.
· Apigee logs where applicable.
· VPC Flow Logs where available.
· Cloud Monitoring metrics.
· Cloud Monitoring logs where available.
· Cloud Logging.
· GKE telemetry where available.
· Cloud Run telemetry where available.
· Compute Engine telemetry where available.
· Application performance telemetry.
· Cloud Audit Logs.
· Security Command Center findings where available.
· HTTP protocol version where available.
· Source IP.
· Source autonomous system where available.
· Source geolocation where available.
· Source network type where available.
· User agent where available.
· TLS or client fingerprint where available.
· Load balancer.
· Forwarding rule.
· URL map.
· Target proxy.
· Backend service.
· Backend bucket where applicable.
· Cloud Armor policy.
· Cloud Armor rule action.
· API Gateway route.
· Apigee proxy where applicable.
· Route.
· Host.
· Origin.
· Business service.
· Tenant where available.
· Project where available.
· Request count.
· Connection count where available.
· Response code.
· Request result.
· Backend status code.
· Backend latency.
· Origin response time where available.
· Request rejection reason where available.
· Protocol-error indicator where available.
· Request timing.
· Byte count.
· Application latency.
· Application error rate.
· Memory utilization.
· CPU utilization.
· Backend-health state.
· Autoscaling telemetry.
· GKE pod state where available.
· Cloud Run revision state where available.
· Compute Engine state where available.
· Business-critical route inventory.
· GCP workload inventory.
· Application ownership inventory.
· Approved route baseline.
· Approved testing records.
· Change-control records.
· Approved-activity records.
· Incident-response records.
Engineering Implementation Instructions
· Build GCP route groups for authentication paths, API routes, payment workflows, customer portals, SaaS front ends, load-balancer backend services, Cloud CDN origins, API Gateway routes, Apigee proxies, GKE ingress paths, Cloud Run services, Compute Engine-backed applications, administrative portals, and high-value application services.
· Build workload-lineage groups connecting load balancers, forwarding rules, URL maps, target proxies, backend services, backend buckets, Cloud Armor policies, API Gateway routes, Apigee proxies, origins, GKE services, Cloud Run services, Compute Engine instances, tenants, projects, routes, and business applications.
· Build source-context groups for repeated source clusters, rare autonomous systems, unusual geographies, hosting providers, proxy networks, unusual user agents, unusual TLS fingerprints where available, abnormal client fingerprints where available, and repeated source patterns.
· Build route-baseline fields for normal HTTP/2 request volume, Cloud Armor action rate, load-balancer error rate, Cloud CDN error rate, API Gateway error rate, Apigee error rate, backend latency, application latency, and transaction-success ratio.
· Build GCP route-anomaly groups for request rejection, Cloud Armor action spikes, protocol-error indicators, elevated 4xx / 5xx responses, backend latency growth, origin error increase, gateway timeout increase, route latency increase, source clustering, and low completion indicators where available.
· Build workload-impact groups for memory pressure, CPU pressure, worker exhaustion, queue growth, backend-health degradation, GKE pod restart, Cloud Run revision instability, container eviction, Compute Engine application error increase, autoscaling surge, application error increase, and user-facing degradation.
· Build approved-activity groups for load testing, performance testing, resilience testing, synthetic monitoring, vulnerability scanning, deployments, failovers, partner integrations, Cloud Armor tuning, CDN configuration changes, security testing, autoscaling, incident response, approved traffic-growth events, and emergency mitigation.
· Use short correlation windows for intense route-targeted anomalies affecting business-critical services.
· Use moderate correlation windows when route-targeted anomalies are lower-rate but align with workload pressure, source clustering, or service-impact telemetry.
· Use longer correlation windows only when repeated route targeting, retained edge telemetry, incident-response evidence, or application-impact evidence supports delayed linkage.
· Add severity weighting for business-critical route class, authentication impact, API impact, payment workflow impact, customer-facing impact, Cloud Armor action spikes, low completion indicators where available, source clustering, workload pressure, service degradation, and absence of approved operational activity.
· Validate GCP log sources, Cloud Monitoring metrics, Cloud Audit Logs, service-lineage mappings, route baselines, timing windows, exception logic, query performance, and false-positive baselines before production deployment.
· Treat business-critical GCP route degradation as a priority amplifier, not standalone proof of HTTP/2 exploitation.
· Do not enable alert mode until business-route inventory, route baselines, protocol fields, source enrichment, workload-impact visibility, exceptions, query performance, SOC triage workflow, and incident-response evidence requirements are validated.
DRI Assessment
DRI
8.1 / 10
· The rule is behaviorally anchored to durable route-targeted HTTP/2-facing cloud-edge behavior and GCP workload-impact correlation rather than static indicators, CVE identifiers, proof-of-concept names, user agents, or source IPs.
· The rule remains useful if an adversary changes source distribution, traffic rate, user agent, request timing, route sequence, load-balancer targeting, backend-service targeting, API route targeting, source infrastructure, or HTTP/2 abuse variant.
· The score is supported by the durability of route targeting, source clustering, Cloud Armor action spikes, request rejection, response errors, backend latency growth, backend-health degradation, workload pressure, and route-level impact against business-critical GCP services.
· The score is constrained by legitimate traffic spikes, load testing, synthetic monitoring, vulnerability scanning, security testing, deployments, incomplete route baselines, weak application ownership mapping, managed-service abstraction, and limited HTTP/2 telemetry.
· The rule is durable as GCP route-impact and workload-impact coverage but should not be treated as standalone proof of HTTP/2 exploitation, memory exhaustion, cloud compromise, workload compromise, or actor attribution.
TCR Assessment
Operational TCR
7.4 / 10
Full-Telemetry TCR
8.7 / 10
· Operational confidence depends on accurate business-route inventory, HTTP/2 protocol visibility where available, Cloud Load Balancing logging, Cloud Armor logging, Cloud CDN logging, API Gateway logging, Apigee logging, route baselines, response-code telemetry, source context, Cloud Monitoring metrics, workload telemetry, application telemetry, and SIEM correlation quality.
· Operational confidence is reduced where route mapping is incomplete, HTTP/2 metadata is unavailable, load-balancer or Cloud Armor logs are delayed, backend context is incomplete, API Gateway or Apigee logs are incomplete, or application telemetry cannot be tied to route-level impact.
· Operational confidence is reduced during load testing, synthetic monitoring, vulnerability scanning, security testing, deployment activity, failover, traffic growth, partner integration changes, Cloud Armor tuning, CDN changes, autoscaling, application performance incidents, incident response, or emergency mitigation.
· Full-telemetry confidence improves when GCP edge logs, Cloud Monitoring metrics, GKE telemetry, Cloud Run telemetry, Compute Engine telemetry, application logs, Cloud Audit Logs, Security Command Center findings, and approved-activity records are correlated.
· Even under full telemetry conditions, this rule should support high-priority investigation and exposure scoping rather than standalone confirmation of exploit success.
Limitations
· Business-critical GCP route degradation can result from normal customer traffic, application regressions, backend dependency failures, deployments, failovers, security testing, Cloud Armor tuning, CDN changes, autoscaling, or load testing.
· Weak route inventory or application ownership mapping can reduce confidence.
· Cloud Load Balancing, Cloud Armor, Cloud CDN, API Gateway, Apigee, and managed-service layers may mask source behavior or normalize route-level anomalies.
· GCP telemetry may not expose full HTTP/2 frame-level behavior or CONTINUATION-frame detail.
· The rule may miss attacks that affect low-visibility routes or are absorbed by Cloud Armor, Cloud CDN, or Cloud Load Balancing before workload impact occurs.
· The rule may miss low-and-slow behavior that degrades service without breaching Cloud Monitoring, backend-health, or application thresholds.
· The rule should not be used for actor attribution without incident-specific intelligence, validated behavioral correlation, or confirmed victim-environment evidence.
Detection Query Pattern
GCP business-critical route targeting and workload-impact correlation query pattern requiring GCP log-source validation, metric-source validation, route inventory validation, source-enrichment validation, service-lineage validation, timing-window tuning, approved operational allowlisting, and false-positive testing before production deployment. In production, this pattern should be implemented through SIEM correlation, Chronicle detections, Cloud Monitoring alerts, Cloud Logging queries, BigQuery / Log Router pipelines, Security Command Center enrichment, or platform-native detections depending on telemetry architecture.
GCPLoadBalancerOrArmorOrGatewayEvent AS GCPBusinessRouteAnomaly
WHERE GCPBusinessRouteAnomaly.Route IN ROUTE_GROUP (
"Authentication Routes",
"API Routes",
"Payment Routes",
"Customer Portals",
"SaaS Front Ends",
"Load Balancer Backend Services",
"Cloud CDN Origins",
"API Gateway Routes",
"Apigee Proxies",
"GKE Ingress Routes",
"Cloud Run Services",
"Business Critical Services"
)
AND (
GCPBusinessRouteAnomaly.ProtocolVersion IN ANY (
"HTTP/2",
"h2",
"h2c"
)
OR GCPBusinessRouteAnomaly.HTTPVersion IN ANY (
"HTTP/2",
"h2",
"h2c"
)
OR GCPBusinessRouteAnomaly.Service IN ANY (
"Cloud Load Balancing",
"Cloud Armor",
"Cloud CDN",
"API Gateway",
"Apigee"
)
)
AND (
GCPBusinessRouteAnomaly.EventPattern IN ANY (
"request_rejection_spike",
"cloud_armor_action_spike",
"protocol_error_increase",
"backend_latency_growth",
"origin_error_increase",
"gateway_timeout_increase",
"route_latency_increase",
"source_cluster_anomaly"
)
OR GCPBusinessRouteAnomaly.ResponseCode IN ANY (
400,
413,
431,
502,
503,
504
)
)
AND OPTIONAL_CONFIDENCE_INCREASE WITHIN ENV_GCP_WORKLOAD_IMPACT_WINDOW (
CloudMonitoringOrWorkloadEvent AS GCPWorkloadImpact
WHERE GCPWorkloadImpact.ServiceLineage IN SAME_SERVICE_LINEAGE(GCPBusinessRouteAnomaly.ServiceLineage)
AND GCPWorkloadImpact.EventPattern IN (
"memory_pressure",
"cpu_pressure",
"worker_exhaustion",
"queue_growth",
"backend_health_degradation",
"gke_pod_restart",
"cloud_run_revision_instability",
"container_eviction",
"compute_engine_application_error_increase",
"autoscaling_surge",
"application_error_increase",
"user_facing_degradation"
)
)
AND NOT ChangeContext IN (
"approved_load_testing",
"approved_performance_testing",
"approved_resilience_testing",
"approved_synthetic_monitoring",
"approved_vulnerability_scanning",
"approved_partner_integration",
"approved_deployment",
"approved_failover",
"approved_traffic_growth_event",
"approved_cloud_armor_tuning",
"approved_cdn_change",
"approved_autoscaling",
"approved_security_testing",
"approved_incident_response",
"approved_emergency_mitigation"
)
S26 Threat-to-Rule Traceability Matrix
Traceability Purpose
This section maps the HTTP/2 header-abuse and memory-exhaustion detection model to the final S25 rule set. The traceability model is behavior-led and shows how the deployed or implementation-ready rules detect suspicious activity across edge, network, endpoint, SIEM, cloud, workload, route, backend-health, and service-impact telemetry without relying on a single CVE identifier, proof-of-concept name, source IP, user agent, scanner name, or static indicator.
Traceability Scope
· This section traces major observable behaviors to the final S25 rules that provide direct or supporting coverage.
· This section does not claim that any single S25 rule independently proves HTTP/2 exploitation, memory exhaustion, application compromise, host compromise, cloud compromise, credential exposure, deployment compromise, persistence, lateral movement, or actor attribution.
· S25 rule outputs should be treated as investigation-ready detection, escalation, exposure-scoping, service-impact triage, and hunt-to-alert promotion evidence after local telemetry validation.
· Confirmation requires validated victim-environment telemetry, incident-response evidence, application evidence, endpoint evidence, workload evidence, cloud evidence where applicable, identity evidence where applicable, and analyst review.
Primary Threat Behavior
HTTP/2-facing edge anomaly involving request rejection, protocol-error increase, WAF / CDN / gateway / load-balancer action spikes, abnormal source clustering, elevated 400, 413, 431, 499, 502, 503, or 504 responses, and suspicious traffic patterns affecting exposed web infrastructure.
Mapped S25 Rules
· NDR / Network Behavioral Analytics: HTTP/2 Edge-Facing Source Cluster and Stream-Behavior Anomaly.
· Splunk: HTTP/2 Protocol Anomaly Correlated With Edge-Service Resource Pressure.
· Elastic: HTTP/2 Protocol Anomaly With Resource and Service-Impact Correlation.
· QRadar: HTTP/2 Protocol Anomaly With Resource and Service-Impact Correlation.
· SIGMA: HTTP/2 Protocol Anomaly With Resource and Service-Impact Correlation.
· AWS: AWS HTTP/2 Edge Anomaly With Target Resource and Service-Impact Correlation.
· Azure: Azure HTTP/2 Edge Anomaly With Backend Resource and Service-Impact Correlation.
· GCP: GCP HTTP/2 Edge Anomaly With Backend Resource and Service-Impact Correlation.
Traceability Assessment
This behavior is strongly covered when edge, gateway, WAF / CDN, load-balancer, source-context, response-code, backend-health, workload, route, and application-impact telemetry can be correlated. NDR / Network Behavioral Analytics provides traffic-behavior visibility. Splunk, Elastic, QRadar, and SIGMA provide SIEM-side correlation. AWS, Azure, and GCP provide cloud-native service-lineage, backend-health, and workload-impact correlation.
Primary Threat Behavior
Backend resource pressure involving memory pressure, CPU pressure, worker exhaustion, queue growth, process restart, service restart, container restart, pod restart, container eviction, out-of-memory behavior, autoscaling surge, application error increase, or user-facing degradation following suspicious HTTP/2-facing activity.
Mapped S25 Rules
· SentinelOne: HTTP/2-Facing Web Infrastructure Memory Pressure and Process Instability.
· Splunk: HTTP/2 Protocol Anomaly Correlated With Edge-Service Resource Pressure.
· Elastic: HTTP/2 Protocol Anomaly With Resource and Service-Impact Correlation.
· QRadar: HTTP/2 Protocol Anomaly With Resource and Service-Impact Correlation.
· SIGMA: HTTP/2 Protocol Anomaly With Resource and Service-Impact Correlation.
· AWS: AWS HTTP/2 Edge Anomaly With Target Resource and Service-Impact Correlation.
· Azure: Azure HTTP/2 Edge Anomaly With Backend Resource and Service-Impact Correlation.
· GCP: GCP HTTP/2 Edge Anomaly With Backend Resource and Service-Impact Correlation.
Traceability Assessment
This behavior is strongly covered because the detection model correlates HTTP/2-facing anomaly evidence with resource pressure, workload instability, or application impact. SentinelOne strengthens process, endpoint, and workload-level validation. Cloud rules strengthen managed-service, autoscaling, backend-health, and service-lineage validation. SIEM rules provide cross-domain correlation and reduce over-attribution risk from isolated error spikes or isolated resource events.
Primary Threat Behavior
Edge-to-origin retry expansion, timeout growth, upstream reset increase, connection refusal, gateway timeout increase, backend latency growth, origin error increase, backend saturation, backend-health degradation, target-health degradation, or route-level service degradation.
Mapped S25 Rules
· NDR / Network Behavioral Analytics: HTTP/2 Edge-to-Origin Retry Expansion and Service-Impact Correlation.
· Splunk: HTTP/2 Edge-to-Application Retry Expansion and Route Degradation.
· Elastic: HTTP/2 Edge-to-Application Retry Expansion and Backend Degradation.
· QRadar: HTTP/2 Edge-to-Application Retry Expansion and Backend Degradation.
· SIGMA: HTTP/2 Edge-to-Application Retry Expansion and Backend Degradation.
· AWS: AWS Edge-to-Origin Retry Expansion and Target-Health Degradation.
· Azure: Azure Edge-to-Origin Retry Expansion and Backend-Health Degradation.
· GCP: GCP Edge-to-Origin Retry Expansion and Backend-Health Degradation.
Traceability Assessment
This behavior is directly covered by the retry-expansion and backend-health rule family. These rules detect service-impact propagation that can follow HTTP/2 header-abuse or memory-exhaustion pressure. Cloud rules provide platform-specific visibility into managed load balancing, WAF / CDN behavior, gateway behavior, backend-health state, autoscaling, and workload telemetry. SIEM rules provide correlation across edge, application, workload, backend, route, and approved-activity sources.
Primary Threat Behavior
Business-critical route targeting involving authentication paths, API routes, payment workflows, customer portals, SaaS front ends, administrative portals, high-value application routes, or externally exposed business services.
Mapped S25 Rules
· NDR / Network Behavioral Analytics: HTTP/2 Resource-Exhaustion Traffic Pattern Affecting Business-Critical Routes.
· Splunk: HTTP/2 Business-Critical Route Targeting With Source and Error Pattern Correlation.
· Elastic: HTTP/2 Business-Critical Route Targeting With Source and Error Pattern Correlation.
· QRadar: HTTP/2 Business-Critical Route Targeting With Source and Error Pattern Correlation.
· SIGMA: HTTP/2 Business-Critical Route Targeting With Source and Error Pattern Correlation.
· AWS: AWS Business-Critical Route Targeting With Cloud Workload Impact.
· Azure: Azure Business-Critical Route Targeting With Cloud Workload Impact.
· GCP: GCP Business-Critical Route Targeting With Cloud Workload Impact.
Traceability Assessment
This behavior is directly covered by the route-targeting rule family. The route-targeting model helps distinguish broad internet noise from potentially meaningful operational impact by prioritizing sensitive routes and services. Confidence depends on accurate route inventory, service-lineage mapping, route baselines, business-service mapping, workload telemetry, application-impact telemetry, source enrichment, and approved-activity context.
Primary Threat Behavior
Abnormal distributed source behavior involving repeated source clustering, unusual autonomous systems, unusual geographies, hosting-provider concentration, proxy-network concentration, unusual user agents, TLS fingerprints where available, client fingerprints where available, or repeated source patterns against exposed HTTP/2 services.
Mapped S25 Rules
· NDR / Network Behavioral Analytics: HTTP/2 Edge-Facing Source Cluster and Stream-Behavior Anomaly.
· NDR / Network Behavioral Analytics: HTTP/2 Resource-Exhaustion Traffic Pattern Affecting Business-Critical Routes.
· Splunk: HTTP/2 Protocol Anomaly Correlated With Edge-Service Resource Pressure.
· Splunk: HTTP/2 Business-Critical Route Targeting With Source and Error Pattern Correlation.
· Elastic: HTTP/2 Protocol Anomaly With Resource and Service-Impact Correlation.
· Elastic: HTTP/2 Business-Critical Route Targeting With Source and Error Pattern Correlation.
· QRadar: HTTP/2 Protocol Anomaly With Resource and Service-Impact Correlation.
· QRadar: HTTP/2 Business-Critical Route Targeting With Source and Error Pattern Correlation.
· SIGMA: HTTP/2 Protocol Anomaly With Resource and Service-Impact Correlation.
· SIGMA: HTTP/2 Business-Critical Route Targeting With Source and Error Pattern Correlation.
· AWS: AWS HTTP/2 Edge Anomaly With Target Resource and Service-Impact Correlation.
· AWS: AWS Business-Critical Route Targeting With Cloud Workload Impact.
· Azure: Azure HTTP/2 Edge Anomaly With Backend Resource and Service-Impact Correlation.
· Azure: Azure Business-Critical Route Targeting With Cloud Workload Impact.
· GCP: GCP HTTP/2 Edge Anomaly With Backend Resource and Service-Impact Correlation.
· GCP: GCP Business-Critical Route Targeting With Cloud Workload Impact.
Traceability Assessment
This behavior is covered as a confidence amplifier rather than a standalone proof condition. Source clustering, source novelty, or source distribution strengthens suspicion when aligned with HTTP/2-facing anomalies, sensitive route targeting, backend pressure, workload instability, application degradation, or absence of approved operational activity. Source context alone should not be used to confirm exploitation, compromise, or actor attribution.
Primary Threat Behavior
Endpoint, process, container, or workload instability involving web-service process restarts, abnormal process behavior where present, service crashes, crash loops, container eviction, pod restart, service degradation, memory pressure, or local workload instability associated with exposed HTTP/2 services.
Mapped S25 Rules
· SentinelOne: HTTP/2-Facing Web Infrastructure Memory Pressure and Process Instability.
· SentinelOne: Suspicious Administrative or Shell Activity on HTTP/2-Affected Web Infrastructure.
· SentinelOne: Unauthorized HTTP/2 Service Configuration or Control-Plane Change After Resource-Exhaustion Event.
· Splunk: HTTP/2 Protocol Anomaly Correlated With Edge-Service Resource Pressure.
· Elastic: HTTP/2 Protocol Anomaly With Resource and Service-Impact Correlation.
· QRadar: HTTP/2 Protocol Anomaly With Resource and Service-Impact Correlation.
· SIGMA: HTTP/2 Protocol Anomaly With Resource and Service-Impact Correlation.
· AWS: AWS HTTP/2 Edge Anomaly With Target Resource and Service-Impact Correlation.
· Azure: Azure HTTP/2 Edge Anomaly With Backend Resource and Service-Impact Correlation.
· GCP: GCP HTTP/2 Edge Anomaly With Backend Resource and Service-Impact Correlation.
Traceability Assessment
This behavior is directly covered where endpoint, container, workload, and runtime telemetry are available. SentinelOne provides the strongest endpoint and workload-level correlation. SIEM and cloud rules extend the model by tying local instability to edge behavior, route sensitivity, backend-health degradation, workload lineage, approved-activity context, and broader service-impact evidence.
Primary Threat Behavior
Suspicious administrative activity, shell activity, service-control activity, configuration modification, cloud CLI activity, Kubernetes CLI activity, credential-access behavior, or control-plane change on infrastructure affected by HTTP/2 resource-exhaustion activity.
Mapped S25 Rules
· SentinelOne: Suspicious Administrative or Shell Activity on HTTP/2-Affected Web Infrastructure.
· SentinelOne: Unauthorized HTTP/2 Service Configuration or Control-Plane Change After Resource-Exhaustion Event.
Traceability Assessment
This behavior is conditionally covered as post-event validation and follow-on activity assessment. It should not be treated as proof of HTTP/2 exploitation by itself. Escalation depends on whether the activity follows suspicious HTTP/2-facing pressure, service degradation, process instability, configuration drift, credential access, or absence of approved operational records. Approved incident response, troubleshooting, maintenance, deployment, security testing, service recovery, and platform automation must be used to suppress or downgrade benign activity.
Primary Threat Behavior
Approved operational activity that can resemble malicious HTTP/2-facing pressure, including load testing, performance testing, resilience testing, synthetic monitoring, vulnerability scanning, deployment activity, failover, autoscaling, maintenance, WAF tuning, CDN changes, Cloud Armor tuning, backend maintenance, security testing, incident response, emergency mitigation, partner integrations, or traffic-growth events.
Mapped S25 Rules
· NDR / Network Behavioral Analytics: All deployed rules.
· SentinelOne: All deployed rules.
· Splunk: All deployed rules.
· Elastic: All deployed rules.
· QRadar: All deployed rules.
· SIGMA: All deployed rules.
· AWS: All deployed rules.
· Azure: All deployed rules.
· GCP: All deployed rules.
Traceability Assessment
Approved-activity correlation is a required suppression, downgrade, and confidence-control layer across the full S25 rule set. This activity does not represent malicious behavior by itself. Its purpose is to reduce false positives, prevent over-attribution, and keep detections investigation-ready rather than automatically exploit-confirming.
Primary Threat Behavior
Confirmed HTTP/2 exploitation, memory exhaustion, application compromise, host compromise, credential exposure, persistence, lateral movement, cloud compromise, deployment compromise, or actor attribution.
Mapped S25 Rules
· No S25 rule confirms these outcomes by itself.
· S25 rules provide suspicious-behavior detection, escalation, scoping, correlation, and investigation-ready evidence.
· Confirmation requires incident-response evidence, validated victim-environment telemetry, application-level evidence, endpoint evidence, workload evidence, cloud-control-plane evidence where applicable, identity evidence where applicable, and analyst validation.
Traceability Assessment
The S25 rule set is designed to detect suspicious behavior and service-impact correlation, not to independently prove compromise or attribution. This separation is intentional and prevents overclaiming from protocol anomalies, cloud service errors, WAF blocks, Cloud Armor denies, backend-health changes, autoscaling, endpoint instability, or application degradation without supporting evidence.
Coverage Summary
The S25 rule set provides strong behavioral coverage for HTTP/2-facing edge anomalies, backend resource pressure, service degradation, retry expansion, backend-health degradation, business-critical route targeting, source-cluster amplification, workload instability, cloud service-lineage impact, and conditional post-event host or control-plane activity. Coverage is strongest when NDR / Network Behavioral Analytics, SentinelOne, SIEM, cloud, workload, application, route-inventory, source-enrichment, approved-activity, and incident-response telemetry are correlated.
Coverage Limitations
· The rule set does not provide standalone proof of HTTP/2 CONTINUATION-frame exploitation or Rapid Reset-style exploitation.
· The rule set may not see frame-level HTTP/2 behavior if edge, CDN, WAF, Cloud Armor, load-balancer, gateway, or cloud-provider telemetry abstracts protocol details.
· The rule set may miss low-and-slow activity that degrades service without triggering edge, backend, workload, Cloud Monitoring, target-health, backend-health, or application thresholds.
· The rule set may miss activity absorbed by CDN, WAF, Cloud Armor, load balancer, gateway, or equivalent edge controls before backend or workload impact occurs.
· The rule set depends on accurate route inventory, service-lineage mapping, workload telemetry, application-impact telemetry, source enrichment, time synchronization, approved-activity context, and local false-positive baselines.
· The rule set should not be used for actor attribution without incident-specific intelligence and confirmed victim-environment evidence.
Traceability Conclusion
The S25 rules provide behavior-led, cross-platform traceability from HTTP/2-facing anomaly detection through backend pressure, service impact, workload instability, business-critical route exposure, source-context amplification, conditional post-event host or control-plane activity, and cloud service-lineage correlation. The model is strongest when deployed as a multi-signal correlation layer rather than isolated single-event alerting. The S25 rule set is suitable for investigation, exposure scoping, service-impact triage, and hunt-to-alert promotion after local telemetry validation, field mapping, baseline testing, exception handling, query-performance testing, and SOC workflow validation.
S27 Behavior & Log Artifacts
Behavioral Artifact Overview
HTTP/2 header-abuse and memory-exhaustion activity produces the strongest detection value when edge, network, application, workload, endpoint, SIEM, and cloud telemetry are correlated into a single service-impact narrative. The most useful artifacts are behavior patterns, not static indicators. Priority should be given to abnormal HTTP/2-facing activity, backend pressure, service degradation, workload instability, business-critical route impact, source-context amplification, and absence of approved operational activity.
Primary Edge and Gateway Artifacts
· Elevated HTTP/2-facing request rejection.
· Increased HTTP/2 protocol-error indicators where available.
· Increased 400, 413, 431, 502, 503, or 504 responses.
· Increased gateway timeouts.
· Increased backend latency.
· Increased origin errors.
· Increased edge-to-origin retries.
· Increased connection resets or upstream reset patterns where available.
· WAF, Cloud Armor, CDN, gateway, load-balancer, or reverse-proxy action spikes.
· Abnormal route-level error concentration.
· Abnormal source clustering against exposed HTTP/2 services.
· Repeated pressure against authentication, API, payment, customer portal, SaaS, administrative, or other business-critical routes.
Network and NDR Artifacts
· Abnormal traffic concentration toward HTTP/2-facing services.
· Source clusters generating repeated request patterns against exposed edge services.
· Unusual autonomous-system or hosting-provider concentration.
· Unusual geolocation concentration.
· Proxy-network or cloud-hosted source concentration.
· Abnormal request cadence or repeated low-completion traffic patterns where visible.
· Edge-to-origin degradation visible through response, retry, reset, or timeout behavior.
· Traffic patterns that align with backend pressure or route-level service degradation.
Endpoint and Workload Artifacts
· Web-service process instability.
· Service restarts.
· Worker exhaustion.
· Memory pressure.
· CPU pressure.
· Queue growth.
· Out-of-memory behavior.
· Container restart.
· Container eviction.
· Pod restart.
· Crash-loop behavior.
· Cloud Run revision instability.
· Application error increases.
· Local service degradation affecting exposed web workloads.
Application and Service Artifacts
· Increased application errors on exposed HTTP/2-facing routes.
· Increased transaction failure rate.
· Increased route latency.
· Increased backend latency.
· Increased API error rate.
· Reduced request completion where measured.
· User-facing service degradation.
· Business-critical workflow disruption.
· Error concentration on authentication, API, payment, portal, administrative, or high-value application paths.
· Application logs showing pressure or failure without an approved operational cause.
Cloud and Managed-Service Artifacts
· AWS CloudFront, AWS WAF, ALB, API Gateway, target-health, ECS, EKS, EC2, Lambda, and CloudWatch anomalies aligned to exposed services.
· Azure Front Door, Azure WAF, Application Gateway, API Management, backend-health, AKS, Container Apps, App Service, Virtual Machine, Azure Monitor, and Defender for Cloud anomalies aligned to exposed services.
· GCP Cloud Load Balancing, Cloud Armor, Cloud CDN, API Gateway, Apigee, backend-health, GKE, Cloud Run, Compute Engine, Cloud Monitoring, Cloud Logging, and Security Command Center anomalies aligned to exposed services.
· Autoscaling activity aligned with HTTP/2-facing pressure and workload impact.
· Managed-service error patterns aligned with service-lineage, route sensitivity, and backend pressure.
· Cloud alerts that support investigation only when correlated with edge, workload, application, and approved-activity context.
SIEM and Correlation Artifacts
· Edge anomaly plus backend pressure correlation.
· Edge anomaly plus workload instability correlation.
· Business-critical route targeting plus application degradation correlation.
· Retry expansion plus backend-health degradation correlation.
· Source clustering plus route sensitivity correlation.
· Cloud-managed-service anomalies plus workload-impact correlation.
· Endpoint instability plus external service-pressure correlation.
· Approved-activity absence across load testing, scanning, deployment, failover, autoscaling, maintenance, WAF tuning, CDN change, security testing, incident response, and emergency mitigation records.
False-Positive and Benign-Lookalike Artifacts
· Approved load testing.
· Approved performance testing.
· Approved resilience testing.
· Synthetic monitoring.
· Vulnerability scanning.
· Deployment activity.
· Failover activity.
· Autoscaling behavior.
· Backend maintenance.
· WAF tuning.
· Cloud Armor tuning.
· CDN configuration changes.
· Ingress or service-mesh changes.
· Partner integration behavior.
· Approved traffic-growth events.
· Security testing.
· Incident-response activity.
· Emergency mitigation.
Artifact Interpretation Guidance
· Edge errors alone should not be treated as proof of exploitation.
· WAF, Cloud Armor, CDN, gateway, or load-balancer actions alone should not be treated as proof of exploitation.
· Backend-health changes alone should not be treated as proof of exploitation.
· Endpoint or workload instability alone should not be treated as proof of exploitation.
· Autoscaling activity alone should not be treated as proof of exploitation.
· Source clustering alone should not be treated as proof of exploitation or attribution.
· Confidence increases when multiple artifact families align across the same service lineage, route, workload, business application, time window, and absence of approved operational activity.
S28 Detection Strategy and SOC Implementation Guidance
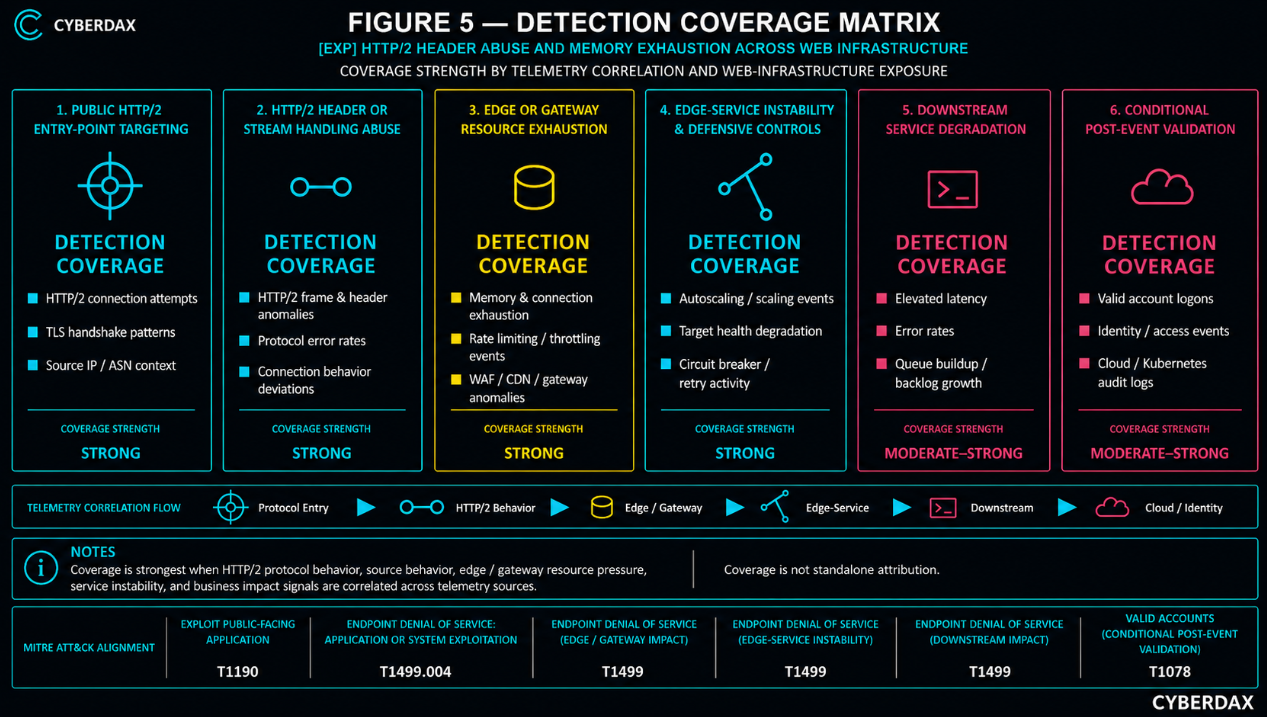
Figure 5
SOC Implementation Objective
The SOC implementation objective is to turn HTTP/2 header-abuse and memory-exhaustion signals into behavior-led correlation detections that support investigation, service-impact triage, exposure scoping, and hunt-to-alert promotion. Implementation should avoid single-event exploitation claims and should prioritize multi-signal correlation across edge, application, workload, endpoint, SIEM, and cloud telemetry.
Initial Triage Workflow
· Identify affected edge services, routes, gateways, load balancers, WAF policies, CDN configurations, and backend services.
· Determine whether the affected services are HTTP/2-facing or behind an HTTP/2-terminating edge layer.
· Review response-code distribution for elevated 400, 413, 431, 502, 503, and 504 responses.
· Review request rejection, protocol-error, gateway-error, retry, timeout, and backend-latency patterns.
· Review whether authentication, API, payment, portal, administrative, SaaS, or other business-critical routes are affected.
· Review source clustering, autonomous systems, geographies, proxy networks, hosting providers, and repeated source behavior.
· Review workload, endpoint, container, pod, process, memory, CPU, queue, autoscaling, and application-impact telemetry.
· Review approved operational activity before escalating severity.
Correlation Requirements
· Correlate edge anomalies with backend-health or target-health changes.
· Correlate edge anomalies with memory pressure, CPU pressure, worker exhaustion, queue growth, or workload instability.
· Correlate route-level anomalies with business-critical route inventory.
· Correlate source clusters with route sensitivity and service impact.
· Correlate application degradation with edge, cloud, network, or workload anomalies.
· Correlate endpoint or workload instability with exposed service lineage.
· Correlate cloud-managed-service alerts with edge, workload, route, and approved-activity context.
· Correlate high-confidence alerts with change-control, maintenance, testing, deployment, failover, autoscaling, and incident-response context.
Severity Guidance
· Treat isolated edge errors as low confidence unless they align with backend, workload, route, or application impact.
· Treat WAF, Cloud Armor, CDN, gateway, or load-balancer actions as investigation signals, not exploit confirmation.
· Escalate when HTTP/2-facing anomalies affect business-critical routes and align with backend pressure or workload instability.
· Escalate when retry expansion, timeout growth, backend-health degradation, and application degradation occur in the same service lineage.
· Escalate when source clustering is repeated, distributed, route-focused, and aligned with service impact.
· Escalate when endpoint, container, pod, or workload instability occurs during suspicious edge pressure.
· Downgrade when activity aligns with approved operational events.
· Avoid actor attribution unless incident-specific intelligence and confirmed victim-environment evidence are available.
Hunt-to-Alert Promotion Criteria
· Promote a hunt pattern to alert mode only after telemetry completeness is validated.
· Promote only after field mappings are validated across edge, SIEM, cloud, endpoint, workload, and application sources.
· Promote only after route inventory and service-lineage mappings are validated.
· Promote only after approved-activity suppression logic is tested.
· Promote only after false-positive baselines are established.
· Promote only after query performance is tested.
· Promote only after SOC triage instructions are documented.
· Promote only after alert outputs clearly distinguish suspicious behavior from confirmed exploitation.
· Do not enable alert mode if the rule depends on unavailable HTTP/2 fields or unvalidated service-lineage joins.
Containment and Response Guidance
· Confirm whether the affected route or service is business-critical.
· Confirm whether the activity is still active.
· Validate whether backend pressure is caused by suspicious external traffic or approved operations.
· Review WAF, Cloud Armor, CDN, gateway, and load-balancer controls for safe tuning options.
· Review application and workload health before applying containment that could worsen service availability.
· Coordinate with application owners, SRE, cloud operations, and incident response before blocking large source groups or changing edge controls.
· Preserve logs, metrics, packet metadata where available, application logs, cloud logs, endpoint telemetry, and workload telemetry for post-incident review.
· Use rate limiting, edge filtering, WAF / Cloud Armor policy tuning, CDN configuration, route protection, autoscaling safeguards, and workload hardening where validated and operationally safe.
SOC Escalation Guidance
· Escalate to incident response when suspicious HTTP/2-facing activity aligns with service degradation, memory pressure, workload instability, or business-critical route impact.
· Escalate to cloud operations when managed load-balancer, WAF, CDN, gateway, backend-health, autoscaling, or cloud workload telemetry is central to the event.
· Escalate to application owners when route-level errors, application degradation, backend latency, or transaction failure are observed.
· Escalate to SRE when availability, retry expansion, backend saturation, or autoscaling instability is observed.
· Escalate to executive or business stakeholders only when material service availability, customer-facing workflows, payment workflows, authentication, or regulated operations are affected.
S29 Detection Coverage Summary
Overall Detection Coverage
The report provides strong behavior-led coverage for HTTP/2-facing edge anomalies, backend resource pressure, retry expansion, backend-health degradation, route-level service impact, business-critical route targeting, workload instability, and cloud service-lineage correlation. Coverage is strongest when telemetry from NDR / Network Behavioral Analytics, SentinelOne, SIEM platforms, cloud platforms, workloads, applications, route inventories, source enrichment, and approved-activity records can be correlated.
Strong Coverage Areas
· HTTP/2-facing edge anomaly detection.
· Request rejection and protocol-error increase.
· WAF, Cloud Armor, CDN, gateway, and load-balancer action spikes.
· Elevated 400, 413, 431, 502, 503, and 504 responses.
· Backend latency growth.
· Retry expansion.
· Gateway timeout increase.
· Backend-health or target-health degradation.
· Business-critical route targeting.
· Source clustering and source-context amplification.
· Workload instability following suspicious edge activity.
· Application degradation aligned with exposed service pressure.
· Cloud-managed-service correlation across AWS, Azure, and GCP.
· SIEM-side behavior correlation across edge, workload, application, cloud, and approved-activity telemetry.
Moderate Coverage Areas
· Low-and-slow service degradation that does not cross edge, backend, workload, or application thresholds.
· HTTP/2 behavior hidden by CDN, WAF, gateway, cloud-provider, or load-balancer abstraction.
· Service degradation where route inventory or service-lineage mapping is incomplete.
· Workload pressure where endpoint, container, pod, or application telemetry is incomplete.
· Source-cluster detection where source enrichment is unavailable or unreliable.
· Managed-service telemetry that is sampled, delayed, normalized, or incomplete.
· Cloud service alerts that lack workload, application, or route context.
Low Coverage Areas
· Frame-level HTTP/2 exploitation evidence when protocol telemetry is not retained.
· Activity fully absorbed by CDN, WAF, Cloud Armor, gateway, or load-balancer controls before backend or workload impact occurs.
· Exploitation claims based only on edge error spikes or WAF / Cloud Armor blocks.
· Actor attribution without incident-specific intelligence.
· Compromise confirmation without endpoint, workload, application, identity, cloud-control-plane, or incident-response evidence.
· Environments without reliable route inventory, service-lineage mapping, workload telemetry, application telemetry, or approved-activity records.
Coverage Dependencies
· HTTP/2-facing service inventory.
· Edge and gateway logs.
· WAF, Cloud Armor, CDN, and load-balancer logs.
· Response-code telemetry.
· Backend-health or target-health telemetry.
· Retry, timeout, and latency telemetry.
· Workload and endpoint telemetry.
· Container and Kubernetes telemetry.
· Cloud Monitoring, CloudWatch, Azure Monitor, and equivalent metric sources.
· Cloud audit and activity logs.
· Application logs and performance telemetry.
· Business-critical route inventory.
· Service-lineage mapping.
· Source enrichment.
· Approved-activity records.
· Change-control records.
· Baseline traffic profiles.
· SOC triage workflows.
Coverage Qualification
The coverage model is investigation-ready and implementation-ready after local mapping. It is not automatically production-deployable without customer-specific validation of log sources, field mappings, service-lineage joins, route inventory, approved-activity exceptions, false-positive baselines, query performance, and SOC escalation workflows. The strongest deployment model uses the rules as multi-signal correlation detections rather than single-event exploit-confirmation alerts.
S30 Intelligence Maturity Assessment
Overall Intelligence Maturity
The intelligence maturity for this report is high for behavior-led detection engineering and moderate for exploit-specific confirmation. The detection model is mature because HTTP/2-facing service pressure, backend degradation, workload instability, business-critical route impact, and cloud service-lineage correlation provide durable behaviors across web infrastructure. Exploit-specific confirmation remains more limited because edge, CDN, WAF, gateway, load-balancer, and cloud-provider layers may abstract or suppress frame-level HTTP/2 detail.
Maturity Strengths
· The report avoids dependence on a single CVE, exploit name, source IP, user agent, scanner name, or static indicator.
· The detection model is reusable across HTTP/2-facing web infrastructure.
· The model is resilient to changes in source infrastructure, traffic distribution, route selection, and protocol-abuse variant.
· The model incorporates edge, network, endpoint, SIEM, cloud, workload, application, and approved-activity telemetry.
· The model separates suspicious behavior from confirmed exploitation.
· The model includes false-positive controls for common operational lookalikes.
· The model supports investigation, triage, scoping, and hunt-to-alert promotion.
Maturity Constraints
· Frame-level HTTP/2 telemetry may not be available in many environments.
· CDN, WAF, Cloud Armor, gateway, load-balancer, and managed-service layers can normalize or abstract attack behavior.
· Local route inventory and service-lineage mapping may be incomplete.
· Workload and application telemetry may be incomplete or delayed.
· Cloud service alerts can be too abstract without supporting route, workload, or application context.
· Approved operational activity can create similar service-impact patterns.
· Exploit confirmation requires incident-specific evidence beyond S25 rule output.
Operational Maturity
Operational maturity is strongest in environments with mature edge logging, SIEM correlation, workload telemetry, cloud telemetry, route inventory, service-lineage mapping, and approved-activity records. These environments can convert the S25 rules into high-value investigation and alerting workflows after local validation.
Operational maturity is reduced in environments where edge telemetry is sampled, HTTP/2 fields are unavailable, route ownership is unclear, application logs are incomplete, cloud logs are delayed, or approved-activity records are not accessible to the SOC.
Detection Engineering Maturity
Detection engineering maturity is high because the rules are behavior-led, multi-signal, and structured around durable service-impact patterns rather than fragile indicators. The model supports cross-platform implementation across NDR / Network Behavioral Analytics, SentinelOne, Splunk, Elastic, QRadar, SIGMA, AWS, Azure, and GCP.
Detection engineering maturity remains dependent on local validation. Production readiness requires field mapping, index mapping, sourcetype mapping, route mapping, service-lineage mapping, baseline testing, exception testing, query-performance testing, and SOC triage validation.
Intelligence Confidence
Confidence is high that the detection strategy can identify suspicious HTTP/2-facing pressure and service-impact correlation when required telemetry exists. Confidence is moderate for precise exploit classification when frame-level protocol evidence is unavailable. Confidence is low for actor attribution unless supported by incident-specific intelligence, infrastructure overlap, victim-environment evidence, or confirmed post-exploitation behavior.
Recommended Intelligence Improvements
· Maintain an inventory of HTTP/2-facing services and edge termination points.
· Maintain route inventory for authentication, API, payment, portal, administrative, SaaS, and other business-critical paths.
· Improve service-lineage mapping from edge to backend to workload to application owner.
· Retain edge, WAF, CDN, gateway, load-balancer, workload, application, and cloud logs for post-incident correlation.
· Add source enrichment for autonomous system, geolocation, hosting provider, proxy network, TLS fingerprint, and client fingerprint where available.
· Integrate approved-activity records into SIEM correlation.
· Build baselines for route-level request volume, response codes, backend latency, retry rate, target health, memory pressure, pod restarts, and application errors.
· Validate rule performance during approved load testing and resilience testing.
· Review detection outcomes after real incidents or service-impact events to tune thresholds and correlation windows.
Final Intelligence Assessment
The report’s intelligence maturity is sufficient for high-value detection engineering, SOC triage, and service-impact correlation. It should be treated as a behavior-led detection and exposure-scoping model, not as a standalone exploit-confirmation or attribution model. The strongest value comes from correlating HTTP/2-facing anomaly evidence with backend pressure, workload instability, business-critical route impact, cloud service-lineage telemetry, approved-activity context, and incident-response validation.
S31 — Telemetry Dependencies
HTTP/2 header abuse and memory exhaustion across web infrastructure requires telemetry that can prove whether suspicious HTTP/2 behavior remained limited to attempted protocol-resource abuse or whether it created resource pressure, gateway instability, defensive-control activation, backend retry expansion, application degradation, customer-facing availability impact, or conditional post-event host, identity, cloud, Kubernetes, or deployment-control-plane activity. The central dependency is the ability to correlate HTTP/2-aware web delivery telemetry, source behavior, edge-service logs, resource telemetry, application performance data, CDN logs, WAF logs, API-gateway logs, load-balancer logs, Kubernetes ingress telemetry, service-mesh telemetry, cloud telemetry, change-control evidence, and incident-response records into a single application-delivery resilience investigation model.
HTTP/2 Protocol and Web Delivery Telemetry
· HTTP/2-facing telemetry must capture protocol version, route, virtual host, listener, method, status code, upstream result, response timing, request rejection, error reason, connection behavior, stream behavior, reset behavior, request cancellation, header-limit events, frame-limit events, and protocol-error events where available.
· Required fields include source IP, source autonomous system, user agent, TLS or client fingerprint where available, protocol version, host, route, listener, edge node, origin, response code, upstream result, response time, bytes, request result, rejection reason, timestamp, and connection context where available.
· HTTP/2 protocol telemetry is required to determine whether suspicious activity involved header abuse, CONTINUATION-frame behavior, stream reset behavior, request cancellation, protocol-error concentration, or request-rejection pressure before resource exhaustion or service degradation appeared.
Reverse Proxy, CDN, WAF, API-Gateway, and Load-Balancer Telemetry
· Edge and gateway telemetry must capture reverse-proxy errors, CDN-to-origin errors, WAF enforcement, API-gateway failures, load-balancer target health, origin health, upstream timeouts, gateway timeouts, request rejection, rate limiting, connection limiting, stream limiting, header limiting, circuit-breaker activation, origin shielding, traffic shaping, and temporary HTTP/2 exposure changes.
· Required fields include edge node, gateway name, CDN property, WAF policy, load-balancer target, origin, backend service, listener, route, virtual host, status code, upstream status, target-health state, rule action, mitigation action, request timing, response timing, timestamp, and service context where available.
· Edge and gateway telemetry is required to determine whether abnormal HTTP/2 behavior caused visible instability, triggered defensive controls, affected origins or backends, or required emergency mitigation.
Resource, Memory, and Execution Telemetry
· Resource telemetry must capture memory utilization, process-level memory growth, CPU pressure, worker exhaustion, thread-pool saturation, event-loop delay, queue depth, file-descriptor pressure, connection-table growth, request backlog, process restart, service restart, crash loop, container restart, pod eviction, node pressure, and out-of-memory behavior.
· Required fields include host, process, container, pod, namespace, node, service, workload, memory usage, CPU usage, worker state, queue depth, connection count, file-descriptor count, restart reason, eviction reason, timestamp, and affected route or service where available.
· Resource telemetry is required to prove whether HTTP/2 protocol behavior created measurable server-side pressure rather than coinciding with unrelated deployment activity, backend failure, scaling event, or infrastructure instability.
Application Performance and Availability Telemetry
· Application telemetry must capture route latency, API latency, application error rates, failed transactions, backend saturation, dependency timeouts, retry storms, queue growth, autoscaling events, health-check failures, customer-facing errors, and user-facing availability degradation.
· Required fields include application, route, API method, tenant or customer context where available, backend service, dependency, error type, latency, retry count, transaction result, health status, timestamp, and business-service mapping.
· Application telemetry is required to determine whether HTTP/2 edge-layer pressure propagated into customer portals, authentication paths, payment workflows, SaaS front ends, APIs, partner integrations, regulated-service portals, or other business-critical services.
Cloud, Kubernetes, Container, and Service-Mesh Telemetry
· Cloud, Kubernetes, container, and service-mesh telemetry must capture load-balancer target health, autoscaling activity, pod restarts, container evictions, node pressure, ingress-controller errors, service-mesh retry expansion, upstream failure propagation, workload rescheduling, namespace impact, and cloud resource scaling behavior.
· Required fields include cloud account, region, load balancer, target group, service, cluster, namespace, pod, container, node, workload identity, ingress resource, service-mesh route, upstream service, scaling event, restart reason, eviction reason, API action, timestamp, and result where available.
· Cloud and Kubernetes telemetry is required to determine whether HTTP/2 resource pressure affected cloud ingress, Kubernetes ingress, service-mesh ingress, backend services, autoscaling behavior, or workload availability.
Network and Source-Behavior Telemetry
· Network telemetry must capture source concentration, connection rate, TLS session behavior, client fingerprinting, user-agent behavior, autonomous system, geolocation, proxy or hosting provider use, request-to-response imbalance, connection persistence, stream churn, byte counts, and distributed source patterns.
· Required fields include source IP, source autonomous system, source geolocation, source network type, user agent, TLS metadata, client fingerprint, destination service, protocol, route, connection count, stream count where available, reset count where available, request count, response count, byte count, timestamp, and result where available.
· Network and source-behavior telemetry is required to identify distributed HTTP/2 activity, source clusters, abnormal client populations, low completion ratios, high reset ratios, unusual client fingerprints, and traffic patterns that resemble but exceed normal browser or mobile-client behavior.
Change-Control, Testing, and Operational Context Telemetry
· Change-control telemetry must capture approved load testing, performance testing, resilience testing, synthetic monitoring, vulnerability scanning, deployments, failovers, CDN changes, WAF tuning, ingress changes, service-mesh updates, API-gateway changes, load-balancer changes, HTTP/2 configuration changes, emergency mitigation, and incident-response actions.
· Required fields include change owner, change type, affected application, affected route, affected infrastructure, approved time window, implementation status, rollback status, testing scope, timestamp, and operational justification where available.
· Change-control and operational context is required to separate suspicious HTTP/2 resource-exhaustion activity from legitimate testing, customer growth, deployment activity, failover, monitoring, maintenance, or emergency response.
Asset, Route, Service, and Business-Criticality Context
· Required context includes HTTP/2-enabled service inventory, web server inventory, reverse-proxy inventory, CDN property inventory, WAF policy inventory, API-gateway inventory, load-balancer listener inventory, Kubernetes ingress inventory, service-mesh route inventory, origin inventory, backend-service inventory, route inventory, tenant mapping, application ownership, and business-criticality classification.
· Route and service mapping should identify authentication paths, API routes, customer portals, payment workflows, SaaS front ends, partner APIs, regulated-service portals, cloud ingress paths, Kubernetes ingress paths, service-mesh ingress paths, and other business-critical application paths.
· Asset, route, service, and business-criticality context is required to determine whether an HTTP/2 resource-exhaustion event affected low-value web noise or business-critical application-delivery infrastructure.
Incident-Response and Post-Event Validation Telemetry
· Incident-response telemetry should capture mitigation actions, manual blocks, WAF rule changes, CDN protection changes, rate-limit changes, stream-limit changes, header-limit changes, connection-limit changes, gateway reloads, service restarts, diagnostic commands, crash-dump handling, log collection, emergency configuration changes, and restoration actions.
· Conditional post-event validation telemetry should capture suspicious shell execution, unauthorized configuration changes, credential use, secret access, cloud API activity, Kubernetes API activity, deployment-control-plane interaction, and unexpected administrative behavior after the HTTP/2 event.
· Incident-response and post-event validation telemetry is required to separate approved operational recovery from suspicious follow-on activity and to avoid inferring compromise from denial-of-service or resource-exhaustion activity alone.
S32 — Detection Limitations
Detection of HTTP/2 header abuse and memory exhaustion across web infrastructure is limited by whether the organization can reconstruct the relationship between HTTP/2 protocol behavior, source behavior, edge-service state, resource pressure, defensive-control activation, downstream service impact, change-control context, and conditional post-event activity. Environments that rely only on generic HTTP status codes, aggregate traffic volume, isolated memory alerts, isolated gateway failures, or application-performance symptoms will not have enough evidence for high-confidence exploitation or impact determination.
Primary Limitations
· Limited HTTP/2 protocol logging may reduce visibility into CONTINUATION-frame behavior, header completion, stream lifecycle, RST_STREAM behavior, request cancellation, frame-limit events, header-limit events, protocol errors, and request-rejection reasons.
· CDN, WAF, proxy, API-gateway, and load-balancer layers may normalize, aggregate, sample, or obscure source behavior, route context, origin impact, upstream result, client fingerprinting, or HTTP/2-specific signals.
· Missing resource telemetry may prevent validation of memory growth, worker exhaustion, thread-pool saturation, event-loop delay, queue growth, connection-table pressure, process restart, container restart, pod eviction, or out-of-memory behavior.
· Application telemetry may show latency, errors, dependency timeouts, transaction failures, or user-facing degradation without proving whether HTTP/2 protocol behavior caused the impact.
· Cloud and Kubernetes telemetry may not clearly connect load-balancer target health, ingress-controller pressure, pod restarts, autoscaling surge, service-mesh retry expansion, or container eviction to the affected HTTP/2 route.
· Network telemetry may capture source volume, connection volume, or TLS metadata without preserving protocol version, stream behavior, request outcome, route context, backend impact, or source-to-service lineage.
· Short retention windows may prevent retrospective validation after service degradation is discovered before the underlying HTTP/2 protocol pattern is identified.
· Weak route-to-service mapping may prevent responders from tying affected virtual hosts, listeners, routes, origins, backend services, pods, workloads, tenants, and business services into one timeline.
· Missing change-control records may increase false positives around load testing, performance testing, resilience testing, synthetic monitoring, vulnerability scanning, deployments, failovers, CDN changes, WAF changes, ingress updates, service-mesh changes, and HTTP/2 configuration changes.
· Poor timestamp normalization can break sequence logic between HTTP/2 protocol anomalies, source behavior, resource pressure, edge-service instability, defensive-control activation, downstream degradation, and incident-response actions.
Detection Boundary
· A single oversized header, malformed request, stream reset, protocol error, 413 response, 431 response, 499 response, proxy warning, memory spike, container restart, pod eviction, or gateway timeout is not proof of exploitation by itself.
· HTTP/2 stream resets and request cancellations should not be treated as malicious without abnormal rate, source behavior, route targeting, protocol context, resource pressure, or service impact.
· CONTINUATION-frame activity should not be treated as malicious without abnormal volume, incomplete header behavior, resource pressure, request rejection, parser stress, or infrastructure instability.
· Memory growth, worker exhaustion, pod restart, autoscaling, target-health degradation, or gateway failure should not be attributed to HTTP/2 abuse without protocol, source, route, timing, and infrastructure lineage.
· Downstream application degradation should not be attributed to HTTP/2 header abuse unless affected routes, listeners, gateways, origins, pods, services, or backends can be tied to abnormal HTTP/2 behavior.
· Outbound communication and backend retry expansion should be used for service-impact correlation, not as default evidence of command-and-control or exfiltration.
· Host, identity, cloud, Kubernetes, or deployment-control-plane activity should remain conditional unless linked to affected infrastructure through timing, identity, host, process, route, workload, cloud, Kubernetes, or incident-response evidence.
· Valid operational activity should not be treated as malicious when it aligns with approved testing, monitoring, deployment, failover, maintenance, security testing, emergency mitigation, or incident-response records.
· Detection logic must not rely on prior alert state, another rule’s output, analyst judgment after alert generation, DRI, or TCR as an input.
· High-confidence alerting should require validated multi-signal correlation across HTTP/2 protocol behavior, source behavior, resource pressure, edge-service instability, service impact, and operational context.
Operational Impact of Limitations
Detection coverage should be reduced, scoped down, or withheld when required telemetry is unavailable, incomplete, delayed, sampled, or not normalized. Suspicious HTTP/2 behavior may be analytically important but unsuitable for high-confidence alerting if the organization cannot validate protocol behavior, source behavior, affected route, resource pressure, edge-service stability, application impact, defensive-control activation, and change-control evidence within bounded and locally validated correlation windows.
S33 — Defensive Control & Hardening Improvements
Defensive improvement should focus on making HTTP/2-facing application delivery measurable, resilient, and recoverable under protocol-resource stress. The objective is not only to tune one web server, proxy, CDN, WAF, or API gateway, but to prove that HTTP/2-enabled routes, edge tiers, gateway layers, ingress paths, backend services, cloud and Kubernetes workloads, and customer-facing applications can absorb or contain resource-exhaustion behavior without prolonged business disruption.
HTTP/2 Exposure and Route Governance
· Maintain a complete inventory of HTTP/2-enabled web servers, reverse proxies, API gateways, WAF-protected applications, load balancers, CDN origins, Kubernetes ingress controllers, service-mesh ingress gateways, application front ends, exposed listeners, virtual hosts, routes, origins, and backend services.
· Classify HTTP/2-facing routes based on authentication exposure, API dependency, payment workflow dependency, SaaS access, partner integration, regulated-service access, customer-facing business value, cloud ingress dependency, Kubernetes ingress dependency, and revenue impact.
· Require auditable change-control for HTTP/2 configuration changes, header-limit changes, stream-limit changes, timeout changes, proxy-buffering changes, CDN routing changes, WAF tuning, API-gateway configuration, ingress changes, service-mesh changes, and load-balancer changes affecting sensitive routes.
· Treat unexplained HTTP/2 configuration changes or mitigation changes affecting business-critical services as application-delivery resilience events requiring validation.
Protocol, Header, Stream, and Connection Hardening
· Review HTTP/2 header limits, frame limits, stream limits, connection limits, timeout settings, request rejection behavior, proxy buffering behavior, HPACK-related handling, upstream timeout settings, and gateway circuit-breaker settings.
· Restrict excessive header sizes, excessive header counts, abnormal continuation behavior, long-lived incomplete request behavior, excessive stream churn, and low-value request patterns where operationally feasible.
· Validate that limits are enforced consistently across CDN, WAF, reverse-proxy, API-gateway, load-balancer, ingress-controller, service-mesh, and application layers.
· Test limit changes against normal customer traffic, mobile-client behavior, partner integrations, browser behavior, synthetic monitoring, and business-critical API behavior before production enforcement.
· Maintain rollback procedures for limit changes that unexpectedly affect legitimate customers or critical integrations.
Edge, Gateway, and Origin Resilience Hardening
· Harden reverse proxies, API gateways, WAF nodes, CDN origins, load-balancer targets, Kubernetes ingress controllers, service-mesh gateways, and application front ends against memory pressure, worker exhaustion, queue growth, connection-table pressure, event-loop delay, and origin overload.
· Configure rate limits, stream limits, header limits, connection limits, request-size limits, upstream timeout controls, origin shielding, gateway circuit breakers, retry budgets, and traffic-shaping controls where operationally appropriate.
· Reduce uncontrolled retry behavior that can amplify edge pressure into backend saturation.
· Validate autoscaling behavior so abnormal HTTP/2 traffic does not create uncontrolled cloud cost, backend instability, or cascading dependency pressure.
· Maintain emergency procedures for traffic shifting, temporary HTTP/2 exposure reduction, origin shielding, WAF rule activation, CDN protection activation, and targeted route-level mitigation.
Cloud, Kubernetes, and Service-Mesh Hardening
· Map cloud load balancers, target groups, Kubernetes ingress resources, namespaces, services, pods, containers, service-mesh routes, sidecars, workload identities, and backend dependencies to HTTP/2-facing routes.
· Configure resource requests, limits, autoscaling thresholds, pod disruption behavior, retry budgets, connection pools, circuit breakers, and health checks to reduce cascading failure from edge-tier HTTP/2 pressure.
· Monitor ingress controllers, service-mesh gateways, sidecars, and application pods for memory pressure, restart loops, eviction events, node pressure, route latency, and upstream retry expansion during abnormal HTTP/2 activity.
· Restrict emergency configuration changes to approved operators and require change records for post-event gateway, ingress, service-mesh, cloud, or Kubernetes adjustments.
· Treat suspicious cloud, Kubernetes, or deployment-control-plane activity after HTTP/2 instability as conditional investigative leads unless tied to affected infrastructure through validated lineage.
Telemetry, Baseline, and Correlation Hardening
· Enable and retain HTTP/2-aware web delivery logs, CDN logs, WAF logs, reverse-proxy logs, API-gateway logs, load-balancer logs, ingress-controller logs, service-mesh logs, resource telemetry, application performance telemetry, cloud telemetry, Kubernetes telemetry, network telemetry, and change-control records long enough for retrospective investigation.
· Normalize timestamps, route names, virtual hosts, listeners, edge nodes, origins, backend services, pods, namespaces, cloud resources, CDN properties, WAF policies, and application identifiers.
· Baseline normal HTTP/2 request volume, stream behavior, reset rates, cancellation rates, header-size distribution, header-count distribution, protocol-error rates, request rejection, memory usage, worker utilization, route latency, backend retries, autoscaling activity, and gateway stability.
· Require multi-signal correlation before high-severity alerting.
· Build operational dashboards that show source behavior, HTTP/2 protocol anomalies, resource pressure, edge-service stability, mitigation activation, application impact, and change-control context in one timeline.
Incident Response and Recovery Hardening
· Create response procedures for suspected HTTP/2 header abuse, CONTINUATION-frame abuse, stream-reset abuse, request-cancellation abuse, memory exhaustion, gateway instability, CDN-to-origin pressure, API-gateway degradation, Kubernetes ingress pressure, service-mesh retry expansion, and downstream application availability loss.
· Require rapid validation of affected routes, source behavior, client fingerprints, protocol anomalies, edge nodes, origins, backend services, resource pressure, mitigation controls, customer impact, and change-control records.
· Prepare decision paths for WAF rule activation, CDN protection activation, rate-limit changes, stream-limit changes, header-limit changes, connection-limit changes, gateway circuit breakers, origin shielding, traffic shaping, autoscaling controls, route isolation, service restart, temporary HTTP/2 exposure reduction, and rollback of disruptive mitigations.
· Treat suspected HTTP/2 resource exhaustion as an application-delivery resilience incident, not a routine web error, isolated malformed request, or generic DDoS alert.
· Require post-event validation to distinguish approved response actions from suspicious host, identity, cloud, Kubernetes, or deployment-control-plane activity.
S34 — Defensive Control & Hardening Architecture

Figure 6
The defensive architecture should treat HTTP/2-enabled web delivery as monitored application-delivery infrastructure rather than an assumed availability layer. The architecture must connect HTTP/2 exposure governance, protocol and request handling controls, edge and gateway resilience, cloud and Kubernetes ingress monitoring, application impact telemetry, change-control context, mitigation workflows, and post-event validation into a single resilience model.
Architecture Layer 1: HTTP/2 Exposure and Business-Service Inventory
HTTP/2 exposure and business-service inventory establishes which services terminate, proxy, inspect, route, or depend on HTTP/2 traffic and which routes carry business-critical value. This layer captures web servers, reverse proxies, API gateways, WAF policies, load balancer listeners, CDN origins, Kubernetes ingress resources, service-mesh gateways, virtual hosts, routes, origins, backend services, application owners, customer-facing workflows, and business-criticality classification.
Architecture Layer 2: Protocol, Header, Stream, and Connection Controls
Protocol, header, stream, and connection controls determine whether HTTP/2 request handling can resist abnormal header behavior, CONTINUATION-frame pressure, stream reset behavior, request cancellation, connection churn, and request-rejection pressure. This layer captures header limits, frame limits, stream limits, connection limits, timeout settings, request-size limits, proxy buffering behavior, route-specific policy, request rejection, and safe rollback procedures.
Architecture Layer 3: Edge, Gateway, CDN, WAF, and Origin Resilience
Edge, gateway, CDN, WAF, and origin resilience determines whether public-facing delivery infrastructure can absorb or contain protocol-resource stress before it creates downstream service impact. This layer captures WAF enforcement, CDN protections, reverse-proxy behavior, API-gateway behavior, load-balancer target health, origin shielding, gateway circuit breakers, rate limits, traffic shaping, retry controls, origin health, and edge-service stability.
Architecture Layer 4: Cloud, Kubernetes, Container, and Service-Mesh Stability
Cloud, Kubernetes, container, and service-mesh stability determines whether HTTP/2 pressure propagates into cloud ingress, Kubernetes ingress, service-mesh ingress, backend workloads, containers, pods, nodes, or autoscaling systems. This layer captures ingress-controller behavior, service-mesh retries, pod restarts, container evictions, resource limits, node pressure, horizontal pod autoscaler activity, cloud load-balancer target health, backend service health, and workload rescheduling.
Architecture Layer 5: Application Performance and Customer-Impact Monitoring
Application performance and customer-impact monitoring determines whether HTTP/2 edge-layer pressure has become a business-service problem. This layer captures route latency, API errors, authentication failures, payment workflow interruption, SaaS access degradation, dependency timeouts, retry storms, failed transactions, user-facing errors, SLA impact, regulated-service access disruption, and customer-impact evidence.
Architecture Layer 6: Change-Control, Testing, and Operational Context
Change-control, testing, and operational context determines whether suspicious-looking HTTP/2 behavior is explained by approved activity. This layer captures load tests, performance tests, resilience tests, synthetic monitoring, vulnerability scanning, deployment windows, failovers, CDN changes, WAF tuning, ingress changes, service-mesh updates, HTTP/2 configuration changes, emergency mitigation, and incident-response actions.
Architecture Layer 7: SOC Correlation and Application-Delivery Resilience Workflow
SOC correlation joins HTTP/2 protocol behavior with source behavior, edge-service logs, resource telemetry, cloud and Kubernetes events, application impact, mitigation activation, change-control records, and incident-response evidence. The response workflow requires source validation, route validation, protocol validation, resource-impact validation, edge-service validation, service-impact scoping, mitigation tuning, customer-impact assessment, and conditional post-event host, identity, cloud, or Kubernetes validation.
Architecture Outcome
The architecture should enable the organization to answer five questions during an incident:
· Which HTTP/2-enabled route, listener, virtual host, edge node, origin, gateway, ingress path, service-mesh route, backend service, application, tenant, or business process was affected?
· Did the activity align with normal customer traffic, browser behavior, mobile-client behavior, partner integrations, synthetic monitoring, vulnerability scanning, load testing, deployment, failover, or approved change-control context?
· Did abnormal HTTP/2 behavior create memory pressure, worker exhaustion, gateway instability, defensive-control activation, backend retry expansion, application latency, or user-facing service degradation?
· Did mitigation actions contain the event without creating unacceptable customer impact, cloud cost surge, backend instability, or prolonged service disruption?
· Can the organization prove that post-event host, identity, cloud, Kubernetes, deployment-control-plane, or administrative activity was approved response activity rather than suspicious follow-on behavior?
S35 — Defensive Control Mapping Matrix
Preventive Controls
· HTTP/2-enabled service inventory.
· Business-critical route classification.
· CDN property governance.
· WAF policy governance.
· Reverse-proxy configuration governance.
· API-gateway configuration governance.
· Load-balancer listener governance.
· Kubernetes ingress governance.
· Service-mesh route governance.
· Header-limit enforcement.
· Frame-limit enforcement.
· Stream-limit enforcement.
· Connection-limit enforcement.
· Request-size limit enforcement.
· Timeout policy governance.
· Proxy-buffering governance.
· Gateway circuit-breaker configuration.
· Retry-budget governance.
· Origin shielding.
· Rate-limit policy governance.
· Traffic-shaping procedures.
· Autoscaling policy governance.
· Cloud and Kubernetes resource-limit governance.
· Change-control governance for HTTP/2, CDN, WAF, ingress, service-mesh, gateway, and load-balancer changes.
Detective Controls
· HTTP/2 protocol telemetry monitoring.
· CONTINUATION-frame anomaly monitoring where available.
· Header-limit and frame-limit monitoring.
· Stream reset and request cancellation monitoring.
· Protocol-error monitoring.
· Request-rejection monitoring.
· Source-cluster monitoring.
· TLS and client-fingerprint monitoring.
· CDN log monitoring.
· WAF log monitoring.
· Reverse-proxy log monitoring.
· API-gateway log monitoring.
· Load-balancer target-health monitoring.
· Kubernetes ingress monitoring.
· Service-mesh telemetry monitoring.
· Resource pressure monitoring.
· Memory growth monitoring.
· Worker exhaustion monitoring.
· Queue-depth monitoring.
· Container restart monitoring.
· Pod eviction monitoring.
· Autoscaling monitoring.
· Application latency monitoring.
· User-facing error monitoring.
· Multi-signal HTTP/2-to-resource-to-service correlation.
Responsive Controls
· WAF rule activation.
· CDN protection activation.
· Rate-limit adjustment.
· Stream-limit adjustment.
· Header-limit adjustment.
· Connection-limit adjustment.
· Timeout adjustment.
· Gateway circuit-breaker activation.
· Origin shielding activation.
· Traffic shaping.
· Connection draining.
· Temporary HTTP/2 exposure reduction.
· Route-level isolation.
· Edge node isolation.
· Origin failover.
· Backend scaling review.
· Kubernetes ingress mitigation.
· Service-mesh retry adjustment.
· Pod or workload restart where required.
· Customer-impact assessment.
· SLA-impact review.
· Post-event host validation.
· Post-event identity validation.
· Post-event cloud validation.
· Post-event Kubernetes validation.
· Application-delivery resilience restoration before return to normal operation.
Governance Controls
· Approved HTTP/2 service inventory.
· Approved route and listener inventory.
· Approved virtual-host inventory.
· Approved CDN property inventory.
· Approved WAF policy inventory.
· Approved reverse-proxy inventory.
· Approved API-gateway inventory.
· Approved load-balancer target inventory.
· Approved Kubernetes ingress inventory.
· Approved service-mesh route inventory.
· Approved origin and backend-service inventory.
· Approved application owner inventory.
· Approved business-critical route classification.
· Approved source baseline.
· Approved partner integration inventory.
· Approved synthetic monitoring inventory.
· Approved vulnerability scanning inventory.
· Approved load-testing records.
· Approved performance-testing records.
· Approved resilience-testing records.
· Change-control records for HTTP/2, CDN, WAF, API-gateway, load-balancer, ingress, service-mesh, cloud, Kubernetes, and application-delivery changes.
· Executive reporting for high-risk application-delivery resilience events.
· Risk-register tracking for HTTP/2 resource-exhaustion and web infrastructure availability exposure.
Control Mapping Summary
The strongest control posture combines prevention of uncontrolled HTTP/2 exposure, detection of protocol-resource abuse, and response workflows that restore application-delivery resilience. Controls should be prioritized for authentication paths, API routes, customer portals, payment workflows, SaaS front ends, regulated-service portals, CDN origins, API gateways, Kubernetes ingress paths, service-mesh ingress paths, cloud ingress paths, and other business-critical web delivery paths.
S36 — CyberDax Intelligence Maturity Assessment
Current Intelligence Maturity
Moderate
Maturity Rationale
HTTP/2 header abuse and memory exhaustion across web infrastructure is a well-defined behavior class, but organization-specific maturity depends on whether HTTP/2 protocol behavior can be correlated with source behavior, edge-service telemetry, resource pressure, defensive-control activation, application impact, cloud or Kubernetes response, change-control evidence, and incident-response activity. Many environments can identify web errors or service degradation, but fewer can reconstruct whether suspicious HTTP/2 activity caused memory exhaustion, gateway instability, backend retry expansion, autoscaling surge, route degradation, or customer-facing availability loss.
Strengths
· The behavior pattern is durable because it focuses on protocol-resource exhaustion and application-delivery impact rather than one CVE, exploit string, product, source IP, user agent, route, error code, proof-of-concept, or vendor event.
· The core sequence is analytically clear: public HTTP/2 entry-point targeting, header or stream handling abuse, edge or gateway resource exhaustion, defensive-control activation, downstream service degradation, conditional post-event validation, and application-delivery trust impact.
· Detection opportunities are strong where HTTP/2 protocol telemetry, CDN logs, WAF logs, reverse-proxy logs, API-gateway logs, load-balancer logs, ingress telemetry, service-mesh telemetry, resource telemetry, application telemetry, cloud telemetry, Kubernetes telemetry, network telemetry, asset inventory, route mapping, and change-control records can be correlated.
· Defensive controls can be mapped directly to HTTP/2 exposure governance, header and stream limits, edge and gateway resilience, cloud and Kubernetes ingress hardening, application performance monitoring, mitigation workflows, and incident-response validation.
· S17 and S18 coverage remains aligned while preserving a lean ATT&CK mapping model.
Maturity Gaps
· HTTP/2-specific telemetry may not expose frame-level behavior, CONTINUATION-frame activity, RST_STREAM behavior, header completion state, HPACK processing behavior, request rejection reason, or stream lifecycle detail.
· CDN, WAF, reverse-proxy, load-balancer, and API-gateway layers may normalize, sample, aggregate, or obscure source behavior, client fingerprints, route context, or origin impact.
· Resource telemetry may not connect memory pressure, worker exhaustion, queue growth, process restart, container restart, pod eviction, or out-of-memory behavior to the affected HTTP/2 route.
· Application telemetry may show latency, failed transactions, dependency timeouts, or user-facing errors without identifying whether affected routes were tied to HTTP/2 edge behavior.
· Cloud and Kubernetes telemetry may not clearly connect autoscaling events, pod restarts, target-health degradation, ingress-controller instability, or service-mesh retry expansion to HTTP/2-facing infrastructure.
· Change-management records may not reliably explain load testing, performance testing, resilience testing, synthetic monitoring, vulnerability scanning, deployments, failovers, CDN changes, WAF tuning, ingress updates, service-mesh updates, or HTTP/2 configuration changes.
· Organizations may over-rely on isolated HTTP errors, memory alerts, traffic volume, source IPs, user agents, scanner names, proof-of-concept names, or CVE identifiers rather than validating the full HTTP/2-to-resource-to-service sequence.
· Post-event host, identity, cloud, Kubernetes, or deployment-control-plane activity may be difficult to separate from approved incident-response or emergency recovery actions.
Maturity Improvement Priorities
· Normalize HTTP/2 protocol telemetry, CDN logs, WAF logs, reverse-proxy logs, API-gateway logs, load-balancer logs, ingress telemetry, service-mesh telemetry, resource telemetry, application telemetry, cloud telemetry, Kubernetes telemetry, network telemetry, SIEM telemetry, and change-control records.
· Improve HTTP/2-enabled service inventory, route inventory, virtual-host mapping, listener mapping, origin mapping, backend-service mapping, application ownership, tenant mapping, business-criticality classification, and cloud or Kubernetes ingress mapping.
· Improve visibility into CONTINUATION-frame behavior, header-limit events, frame-limit events, stream reset behavior, request cancellation, protocol errors, request rejection, resource pressure, gateway instability, protective-control activation, and downstream service impact.
· Improve baselines for HTTP/2 request volume, stream behavior, reset rates, cancellation rates, header-size distribution, header-count distribution, request rejection, memory usage, worker utilization, route latency, backend retries, autoscaling behavior, and gateway stability.
· Improve correlation between suspicious HTTP/2 behavior and downstream resource, edge-service, application, cloud, Kubernetes, mitigation, and customer-impact evidence.
· Add HTTP/2 resource-exhaustion and application-delivery resilience validation steps to SOC, platform engineering, cloud, Kubernetes, application, and incident-response playbooks.
Maturity Outlook
Maturity can improve quickly if the organization prioritizes HTTP/2 protocol visibility, route-to-service lineage, resource-to-route correlation, change-control integration, and mitigation readiness. The highest-value improvements are HTTP/2-aware logging, CDN and WAF telemetry retention, gateway and ingress resource monitoring, application impact mapping, cloud and Kubernetes event correlation, approved-testing baselines, and integrated SOC, platform, network, application, cloud, Kubernetes, and incident-response workflows.
S37 — Strategic Defensive Improvements
Strategic improvement should reduce the likelihood that attackers can abuse HTTP/2 protocol behavior without detection and reduce the response burden when application-delivery impact cannot be validated quickly. The objective is measurable application-delivery resilience, not web-server or CDN tuning alone.
Priority 1: Establish HTTP/2 Application-Delivery Resilience as a Security Metric
· Define measurable assurance metrics for HTTP/2-enabled service inventory, business-critical route mapping, header and stream limit coverage, gateway resilience, resource-to-route correlation, CDN and WAF visibility, Kubernetes ingress monitoring, service-mesh monitoring, application impact mapping, and mitigation readiness.
· Track resilience completeness for authentication paths, API routes, customer portals, payment workflows, SaaS front ends, regulated-service portals, CDN origins, API gateways, Kubernetes ingress paths, service-mesh ingress paths, and cloud ingress paths.
· Report unresolved HTTP/2 telemetry, routing, mitigation, and resource-correlation gaps as application-delivery resilience risks.
· Treat unexplained HTTP/2 instability affecting business-critical routes as an executive-relevant availability and customer-trust issue.
Priority 2: Harden HTTP/2 Exposure, Header, Stream, and Connection Governance
· Maintain a live inventory of HTTP/2-enabled web servers, reverse proxies, API gateways, WAF-protected applications, load balancers, CDN origins, Kubernetes ingress controllers, service-mesh gateways, virtual hosts, listeners, routes, origins, backend services, and application owners.
· Classify routes by authentication dependency, API dependency, payment workflow dependency, SaaS access, regulated-service access, customer-facing business value, cloud ingress dependency, Kubernetes ingress dependency, service-mesh ingress dependency, and revenue impact.
· Require change-control evidence for HTTP/2 configuration changes, stream-limit changes, header-limit changes, connection-limit changes, timeout changes, CDN changes, WAF changes, API-gateway changes, ingress updates, service-mesh updates, and load-balancer changes affecting sensitive routes.
· Reduce unmanaged, unknown, inconsistently tuned, or poorly monitored HTTP/2-facing service paths.
Priority 3: Strengthen Edge, Gateway, Cloud, Kubernetes, and Service-Mesh Resilience
· Harden reverse proxies, API gateways, WAF nodes, CDN origins, load balancer targets, Kubernetes ingress controllers, service-mesh gateways, and application front ends against abnormal header behavior, stream churn, request cancellation, memory pressure, worker exhaustion, and backend retry expansion.
· Validate rate limits, stream limits, header limits, connection limits, request-size limits, timeout settings, gateway circuit breakers, origin shielding, retry budgets, autoscaling policies, and traffic-shaping procedures under realistic customer and attack-like conditions.
· Reduce retry amplification and backend saturation risks across CDN-to-origin, WAF-to-origin, API-gateway-to-backend, ingress-to-service, and service-mesh-to-upstream paths.
· Build emergency mitigation paths that can reduce HTTP/2 exposure or isolate affected routes without unnecessarily disrupting unrelated business-critical services.
Priority 4: Improve HTTP/2 Telemetry and Correlation
· Improve telemetry that links HTTP/2 protocol behavior, source behavior, CDN logs, WAF logs, reverse-proxy logs, API-gateway logs, load-balancer logs, ingress logs, service-mesh logs, resource telemetry, application performance data, cloud events, Kubernetes events, network telemetry, and change-control records.
· Baseline normal HTTP/2 request volume, stream count, stream reset rate, cancellation rate, header-size distribution, header-count distribution, protocol-error rate, request rejection, resource usage, gateway errors, route latency, backend retries, autoscaling, and customer-facing error rates.
· Prioritize detection for suspicious HTTP/2 behavior followed by memory pressure, worker exhaustion, gateway instability, defensive-control activation, backend retry expansion, autoscaling surge, route degradation, or user-facing availability loss.
· Validate timestamp normalization, field mapping, lookup accuracy, schema mapping, enrichment quality, exception logic, and SIEM correlation before promoting hunt logic into high-severity alerting.
Priority 5: Improve Service-Impact, Mitigation, and Customer-Exposure Correlation
· Correlate suspicious HTTP/2 behavior with affected route, origin, backend service, application owner, tenant, customer workflow, API method, authentication path, payment workflow, SaaS access path, regulated-service portal, and business service.
· Monitor mitigation activity after suspicious HTTP/2 behavior, including WAF enforcement, CDN protection, rate limiting, stream limiting, header limiting, connection limiting, circuit-breaker activation, origin shielding, autoscaling, traffic shaping, connection draining, and temporary HTTP/2 exposure reduction.
· Treat downstream service degradation as an investigative lead unless linked to suspicious HTTP/2 behavior through source, route, protocol, timing, resource, gateway, application, cloud, Kubernetes, or incident-response lineage.
· Build incident-response workflows that scope application-delivery impact across edge, origin, backend, cloud, Kubernetes, service mesh, application, customer, SLA, and regulated-service exposure.
Priority 6: Strengthen SOC, Platform, Cloud, Kubernetes, and Application Response
· Create or update playbooks for HTTP/2 header abuse, CONTINUATION-frame abuse, stream-reset abuse, request-cancellation abuse, memory exhaustion, gateway instability, CDN-to-origin pressure, API-gateway degradation, Kubernetes ingress pressure, service-mesh retry expansion, and downstream application availability loss.
· Require responders to validate source behavior, client fingerprints, HTTP/2 protocol behavior, affected routes, edge-service state, resource pressure, mitigation activation, application impact, change-control context, and conditional post-event activity.
· Require rapid decision paths for WAF changes, CDN protections, rate limits, stream limits, header limits, connection limits, gateway circuit breakers, origin shielding, traffic shaping, autoscaling review, temporary HTTP/2 exposure reduction, service restoration, and rollback of disruptive mitigations.
· Require application-delivery resilience restoration before affected HTTP/2-facing routes, gateways, origins, ingress paths, service-mesh routes, backend services, mitigation controls, or customer-facing services return to normal operation.
Strategic Outcome
The organization should be able to prove whether suspicious HTTP/2 behavior affected application delivery, detect when HTTP/2-to-resource-to-service evidence does not reconcile, scope edge, origin, backend, cloud, Kubernetes, service-mesh, application, customer, SLA, and regulated-service exposure with confidence, and restore application-delivery resilience before attackers convert protocol-resource abuse into broader business disruption.
S38 — Attack Economics & Organizational Impact Model
HTTP/2 header abuse and memory exhaustion across web infrastructure changes the economics of disruption by allowing adversaries to pressure the application-delivery layer instead of compromising each downstream system individually. When suspicious HTTP/2 header behavior, CONTINUATION-frame activity, stream resets, request cancellation, protocol errors, or request-rejection patterns create memory pressure, worker exhaustion, gateway instability, backend retry expansion, defensive-control activation, autoscaling surge, or customer-facing service degradation, the attacker can increase operational leverage while forcing defenders to validate whether exposed web infrastructure remained resilient.
Adversary Economic Advantage
· HTTP/2 protocol-resource abuse can reduce attacker friction because exposed web servers, reverse proxies, API gateways, WAF-protected applications, load balancers, CDN origins, Kubernetes ingress controllers, service-mesh gateways, and application front ends already process internet-facing traffic.
· Header abuse, CONTINUATION-frame behavior, stream resets, and request cancellation can create disproportionate server-side work compared with completed requests or successful application transactions.
· Activity can blend with legitimate browser behavior, mobile-network instability, synthetic monitoring, vulnerability scanning, load testing, failover, deployments, or high-volume customer traffic.
· A single affected route, gateway, origin, ingress controller, service-mesh path, API route, authentication path, payment workflow, or SaaS front end can create disproportionate business impact when it supports customer-facing or regulated services.
· The attacker benefits when defenders cannot quickly determine whether resource pressure, gateway instability, backend latency, autoscaling surge, or user-facing errors were caused by malicious HTTP/2 behavior or approved operational activity.
Defender Cost Expansion
· The organization must investigate both the suspicious HTTP/2 activity and the reliability of the affected application-delivery path.
· Response teams may need to reconstruct protocol behavior, source behavior, edge-service logs, CDN and WAF activity, load-balancer target health, API-gateway behavior, ingress-controller state, service-mesh retries, resource telemetry, application performance, cloud events, Kubernetes events, change-control evidence, and incident-response actions.
· Mitigation may require WAF rule activation, CDN protection changes, rate-limit tuning, stream-limit tuning, header-limit tuning, connection-limit changes, gateway circuit breakers, origin shielding, traffic shaping, autoscaling review, route isolation, temporary HTTP/2 exposure reduction, or rollback of disruptive mitigations.
· Internal exposure scoping may be required across customer portals, APIs, authentication paths, payment workflows, SaaS front ends, regulated-service portals, CDN origins, cloud ingress paths, Kubernetes ingress paths, service-mesh ingress paths, and backend services.
· Response cost increases when HTTP/2 protocol fields, frame-level diagnostics, route-to-service mapping, resource telemetry, application telemetry, cloud telemetry, Kubernetes telemetry, change-control records, or timestamp normalization are incomplete.
· Business impact increases when defenders must prove whether customer-facing availability, SLA performance, payment workflows, authentication, API reliability, regulated-service access, or customer trust were affected.
Organizational Impact Model
Application-Delivery Availability Impact
The organization must determine whether abnormal HTTP/2 behavior affected exposed routes, gateways, origins, ingress paths, backend services, customer portals, APIs, authentication paths, payment workflows, SaaS front ends, regulated-service portals, or other business-critical web services.
Infrastructure Resource Impact
The organization must determine whether suspicious HTTP/2 behavior created memory pressure, worker exhaustion, CPU pressure, event-loop delay, queue growth, connection-table pressure, process instability, container restart, pod eviction, node pressure, or out-of-memory behavior.
Defensive-Control Impact
The organization must determine whether WAF enforcement, CDN protections, rate limits, stream limits, header limits, connection limits, gateway circuit breakers, origin shielding, autoscaling, traffic shaping, connection draining, or temporary HTTP/2 exposure reduction contained the event or created additional customer impact.
Cloud, Kubernetes, and Service-Mesh Impact
The organization must determine whether edge-layer pressure propagated into cloud load balancers, Kubernetes ingress controllers, service-mesh gateways, backend services, autoscaling systems, containers, pods, nodes, namespaces, or workload availability.
Recovery Impact
The organization must restore application-delivery resilience through HTTP/2 exposure review, route validation, edge and gateway tuning, WAF and CDN mitigation review, cloud and Kubernetes scaling review, service-mesh review, application performance validation, customer-impact assessment, and post-event validation.
Governance Impact
Leadership may need to treat confirmed or strongly suspected HTTP/2 resource exhaustion as an executive-level resilience incident because the affected infrastructure supports customer access, business transactions, regulated-service continuity, API reliability, and digital-service trust.
Economic Impact Summary
HTTP/2 header abuse and memory exhaustion is economically powerful for adversaries because it can convert normal protocol handling into resource pressure, edge-service instability, downstream service degradation, and customer-facing disruption. The organization’s financial exposure grows when it cannot quickly prove whether application delivery, route stability, backend resilience, mitigation controls, and customer-facing services remained reliable during the event window.
S39 — Economic Impact & Organizational Exposure

Figure 7
HTTP/2 header abuse and memory exhaustion creates organizational exposure by increasing uncertainty around application-delivery resilience, HTTP/2-facing route stability, gateway capacity, origin reliability, backend service availability, cloud and Kubernetes ingress behavior, service-mesh retry behavior, mitigation readiness, SLA exposure, and customer-facing service continuity. Exposure rises when suspicious activity affects authentication paths, API routes, payment workflows, customer portals, SaaS front ends, CDN origins, regulated-service portals, Kubernetes ingress paths, service-mesh ingress paths, or other business-critical web delivery paths.
Estimated Economic Exposure
Estimated exposure should be treated as scenario-based rather than fixed. The most defensible enterprise estimate is tied to whether the activity remains attempted or low-volume protocol-resource abuse, becomes confirmed or strongly suspected HTTP/2 resource exhaustion with limited service impact, or expands into prolonged customer-facing outage, repeated gateway instability, regulated-service disruption, cloud or Kubernetes scaling pressure, SLA exposure, emergency mitigation, legal review, customer communication, or board-level response.
Low Impact Scenario
Estimated $250K – $1.5M.
This scenario applies when suspicious HTTP/2 header, stream-reset, request-cancellation, protocol-error, or request-rejection activity is detected quickly, no sustained memory exhaustion is confirmed, no prolonged gateway instability occurs, no major customer-facing outage is observed, no regulated service is materially disrupted, and telemetry is sufficient to validate the source-to-route-to-resource chain quickly.
Moderate Impact Scenario
Estimated $2M – $10M.
This scenario applies when confirmed or strongly suspected HTTP/2 resource-exhaustion activity causes intermittent degradation, gateway errors, memory pressure, worker exhaustion, backend retries, target-health changes, autoscaling surge, or limited customer-facing service interruption across business-critical web routes. Response may require expanded proxy, CDN, WAF, load-balancer, API-gateway, ingress, service-mesh, cloud, Kubernetes, resource, and application telemetry review; emergency limit tuning; mitigation validation; customer-impact assessment; SOC surge activity; engineering support; executive reporting; and follow-on hardening.
High Impact Scenario
Estimated $12M – $60M+.
This scenario applies when HTTP/2 resource-exhaustion activity causes prolonged or repeated customer-facing outage, degradation of authentication or payment workflows, API unavailability, SaaS front-end instability, multi-region edge failure, CDN-to-origin pressure, Kubernetes ingress instability, cloud autoscaling surge, material SLA exposure, revenue interruption, regulatory scrutiny, or broad loss of confidence in application-delivery resilience. The upper range applies when the organization must sustain emergency mitigation, temporarily reduce HTTP/2 exposure, shift traffic across regions or providers, rebuild or reconfigure gateway and ingress layers, expand cloud capacity under pressure, conduct customer or regulator communications, support legal or cyber-insurance review, and validate that service instability did not mask conditional host, identity, cloud, Kubernetes, or deployment-control-plane activity.
Annualized Risk Exposure
Estimated $2M – $12M+ for materially exposed enterprise environments with broad HTTP/2 dependency, business-critical web routes, customer-facing APIs, CDN-to-origin exposure, Kubernetes ingress dependency, incomplete HTTP/2 telemetry, limited route-to-service mapping, weak resource baselines, or limited change-control integration. Exposure may exceed $25M – $60M+ where prolonged or repeated outages affect authentication, payment, SaaS, regulated, or revenue-generating services; emergency mitigation requires broad HTTP/2 reconfiguration; telemetry gaps force extended incident validation; or customer, SLA, legal, regulatory, cyber-insurance, executive, and board-level response is required.
Operational Dependency
Operational dependency is high where HTTP/2-facing infrastructure supports authentication, APIs, customer portals, payment workflows, SaaS access, regulated-service portals, CDN origins, cloud ingress, Kubernetes ingress, service-mesh ingress, partner integrations, and other business-critical web delivery paths. Dependency increases when the affected routes support revenue, customer onboarding, customer support, regulated access, operational dashboards, or recovery-critical digital services.
Control Trust
Control trust is reduced when the organization cannot prove that HTTP/2 limits, route mapping, gateway behavior, WAF policy, CDN protections, load-balancer target health, ingress-controller behavior, service-mesh retry behavior, resource telemetry, application telemetry, mitigation actions, and change-control context remained reliable during the event. Control trust is further reduced when protocol fields, frame-level diagnostics, resource telemetry, cloud telemetry, Kubernetes telemetry, or route-to-service lineage are incomplete.
Visibility Confidence
Visibility confidence is highest when HTTP/2 protocol telemetry, CDN logs, WAF logs, reverse-proxy logs, API-gateway logs, load-balancer logs, ingress-controller logs, service-mesh telemetry, resource telemetry, application telemetry, cloud logs, Kubernetes logs, network telemetry, route inventory, business-criticality context, change-control records, and SIEM correlation can be joined reliably. Visibility confidence is reduced where HTTP/2 frame-level behavior is unavailable, edge logs are sampled, resource telemetry lacks route context, application telemetry lacks business-service mapping, or timestamps are inconsistent.
Change-Control Confidence
Change-control confidence is high when load tests, performance tests, resilience tests, synthetic monitoring, vulnerability scans, deployments, failovers, CDN changes, WAF tuning, API-gateway changes, ingress changes, service-mesh updates, HTTP/2 configuration changes, emergency mitigation, and incident-response actions are documented and attributable. Confidence is reduced when change-control records are incomplete, delayed, inconsistent, or unavailable during suspicious HTTP/2 resource-exhaustion review.
Downstream Dependency
Downstream dependency is high when HTTP/2-facing edge infrastructure supports backend services, APIs, databases, authentication systems, partner services, cloud workloads, Kubernetes services, service-mesh paths, payment systems, customer portals, operational dashboards, and regulated-service workflows. These dependencies increase the impact of even a short-lived HTTP/2 resource-exhaustion event when backend retries, autoscaling surge, target-health degradation, or customer-facing errors propagate beyond the edge tier.
Customer and Regulatory Exposure
Customer and regulatory exposure increases when suspicious HTTP/2 activity may have affected customer access, payment completion, authentication reliability, regulated-service portals, healthcare or financial-service workflows, public-sector services, SLA commitments, incident notification thresholds, or customer trust. Exposure also increases when incomplete telemetry prevents timely confirmation of whether service degradation was malicious, operational, or caused by approved testing or deployment activity.
Residual Economic Risk
Residual economic risk remains after containment if the organization cannot prove that HTTP/2 exposure was reviewed, affected routes were validated, gateway limits were tuned, WAF and CDN mitigations were tested, resource baselines were restored, cloud and Kubernetes scaling behavior was reviewed, application impact was scoped, customer-facing availability was restored, and conditional post-event activity was separated from approved response actions. Residual risk is highest where protocol evidence, edge logs, resource telemetry, application telemetry, cloud logs, Kubernetes logs, change-control records, or route-to-service mapping are incomplete.
Proof-of-Concept Behavioral Coverage Assessment
This assessment is anchored to the HTTP/2 protocol-resource exhaustion behavior class rather than a single vulnerability. The coverage model is designed to show how the same detection strategy can remain relevant when different CVEs, proof-of-concept paths, or implementation-specific weaknesses produce the same operational outcomes: abnormal HTTP/2 header behavior, CONTINUATION-frame activity, stream reset behavior, request cancellation, protocol errors, request rejection, memory pressure, worker exhaustion, gateway instability, backend retry expansion, defensive-control activation, autoscaling surge, route degradation, or customer-facing availability loss.
The model should not be read as universal exploit detection, universal HTTP/2 implementation coverage, universal DDoS prevention, or universal zero-day prevention. It demonstrates coverage when a known CVE, new proof-of-concept, or future vulnerability produces observable HTTP/2 protocol anomalies, source-behavior anomalies, resource pressure, edge-service instability, downstream service degradation, or application-delivery impact.
CVE / Proof-of-Concept Behavioral Coverage Scope
This assessment applies to CVEs and proof-of-concept activity that can affect HTTP/2 request cancellation, stream reset handling, header processing, CONTINUATION-frame handling, header completion, frame limits, header limits, protocol parsing, request rejection, memory allocation, worker utilization, CPU utilization, gateway stability, backend retry behavior, or service availability. CVEs that affect unrelated web features, authentication, authorization, code execution, or data exposure should not be counted as direct coverage unless observed activity links them to the HTTP/2 resource-exhaustion behavior chain.
Detection Engineering Coverage Interpretation
Coverage is strongest when proof-of-concept or exploit activity results in observable HTTP/2 protocol anomalies, abnormal source behavior, high reset-to-completion ratios, request cancellation spikes, excessive or incomplete header behavior, CONTINUATION-frame anomalies, protocol errors, request rejection, memory growth, worker exhaustion, gateway errors, backend retry expansion, target-health degradation, autoscaling surge, or user-facing service degradation. Coverage is weaker when exploit activity produces no observable difference in HTTP/2 logs, edge-service logs, resource telemetry, application telemetry, network telemetry, cloud telemetry, Kubernetes telemetry, change-control records, or SIEM telemetry.
Direct Coverage
Direct behavioral coverage applies to the following CVEs when exploitation or abuse produces observable HTTP/2 request-cancellation, header-processing, CONTINUATION-frame, stream-reset, resource-exhaustion, gateway-instability, or service-impact behavior:
· CVE-2023-39325 — Go net/http and net/http2 HTTP/2 rapid-reset resource consumption. This is directly covered when activity produces rapid request creation and stream resets, excessive server-side work, high reset-to-completed-request ratios, handler or worker pressure, resource exhaustion, or service degradation.
· CVE-2023-44487 — HTTP/2 Rapid Reset request-cancellation resource consumption. This is directly covered when activity produces rapid stream resets, high reset-to-completed-request ratios, abnormal request cancellation, edge-service pressure, gateway instability, backend degradation, or user-facing availability impact.
· CVE-2023-45288 — Go net/http and net/http2 CONTINUATION-frame CPU consumption. This is directly covered when activity produces excessive CONTINUATION-frame behavior, large header processing, CPU pressure, request rejection, resource pressure, or HTTP/2-facing service degradation.
· CVE-2024-24549 — Apache Tomcat HTTP/2 header-limit and delayed stream-reset denial-of-service behavior. This is directly covered when activity produces excessive header processing, delayed stream reset behavior, resource pressure, gateway instability, or service degradation.
· CVE-2024-2653 — amphp/http CONTINUATION-frame unbounded buffering behavior. This is directly covered when activity produces incomplete header processing, excessive CONTINUATION-frame handling, memory growth, out-of-memory behavior, or request-processing instability.
· CVE-2024-27268 — IBM WebSphere Application Server Liberty HTTP/2 denial-of-service behavior. This is directly covered when activity produces specially crafted HTTP/2 request behavior, memory resource consumption, service degradation, or application-layer availability impact.
· CVE-2024-27316 — Apache HTTP Server HTTP/2 CONTINUATION-frame denial-of-service behavior. This is directly covered when activity produces incomplete header completion, excessive CONTINUATION-frame handling, resource pressure, request rejection, process instability, or downstream availability impact.
· CVE-2024-2758 — Tempesta FW HTTP/2 CONTINUATION-frame denial-of-service behavior. This is directly covered when activity produces continuation-frame pressure, protocol errors, memory or CPU pressure, gateway instability, or service impact.
· CVE-2024-27919 — Envoy HTTP/2 header-map limit and CONTINUATION-frame memory-exhaustion behavior. This is directly covered when activity produces excessive CONTINUATION-frame handling, unbounded header behavior, memory pressure, gateway instability, process instability, or service degradation.
· CVE-2024-27983 — Node.js HTTP/2 continuation-related denial-of-service behavior. This is directly covered when activity produces HTTP/2 protocol errors, stream handling anomalies, request-processing instability, memory or CPU pressure, or service degradation.
· CVE-2024-28182 — nghttp2 HTTP/2 CONTINUATION-frame visibility and denial-of-service behavior. This is directly covered when activity produces continuation-frame anomalies, delayed stream reset behavior, resource pressure, protocol errors, request rejection, or service impact.
· CVE-2024-30255 — Envoy HTTP/2 CONTINUATION-frame CPU exhaustion. This is directly covered when activity produces excessive CONTINUATION-frame handling, CPU pressure, gateway instability, stream handling anomalies, or service degradation.
· CVE-2024-31309 — Apache Traffic Server HTTP/2 CONTINUATION-frame resource consumption. This is directly covered when activity produces continuation-frame pressure, resource consumption, gateway errors, upstream timeout growth, origin pressure, or service degradation.
Coverage With Adaptation
Coverage with adaptation applies to related HTTP/2 implementation, proxy, gateway, CDN, WAF, load-balancer, ingress-controller, service-mesh, runtime, or application-server vulnerabilities where the local incident shows the same protocol-resource exhaustion behavior but uses a different implementation detail, request pattern, timing profile, route selection, source distribution, or mitigation bypass.
· Future HTTP/2 header-processing vulnerabilities are covered with adaptation when activity produces abnormal header behavior, request rejection, parser stress, memory pressure, worker exhaustion, or gateway instability.
· Future HTTP/2 stream-reset or request-cancellation vulnerabilities are covered with adaptation when activity produces abnormal reset-to-completion ratios, request cancellation spikes, stream churn, CPU pressure, connection-table pressure, or service impact.
· Future HTTP/2 frame-handling vulnerabilities are covered with adaptation when activity produces CONTINUATION-frame anomalies, frame-limit pressure, protocol errors, incomplete stream behavior, or resource exhaustion.
· Future reverse-proxy, CDN, WAF, API-gateway, load-balancer, ingress-controller, service-mesh, or application-server implementation issues are covered with adaptation when activity can be linked to HTTP/2 protocol anomalies, resource pressure, edge-service instability, or downstream service degradation.
· Adaptation may require local tuning for HTTP/2 field availability, frame visibility, route naming, gateway event names, CDN and WAF normalization, cloud logging schemas, Kubernetes audit fields, service-mesh telemetry, timing windows, route-criticality mapping, approved-activity records, exception lists, and false-positive handling.
Limited / Non-Direct Coverage
Limited or non-direct coverage applies where a vulnerability affects a web server, proxy, gateway, CDN, WAF, load balancer, ingress controller, service mesh, runtime, or application platform but does not directly affect HTTP/2 request cancellation, stream reset behavior, header processing, CONTINUATION-frame handling, protocol parsing, resource exhaustion, gateway stability, or service availability.
· General web-server remote code execution should not be counted as direct coverage unless incident evidence links it to HTTP/2 protocol-resource behavior or post-event host activity tied to affected HTTP/2 infrastructure.
· General information disclosure should not be counted as direct coverage unless the exposed data materially supports HTTP/2 route targeting, mitigation bypass, or service-impact scoping.
· Authentication or authorization vulnerabilities should remain outside direct coverage unless they produce HTTP/2 resource-exhaustion behavior or materially affect the HTTP/2-facing delivery path.
· Pure volumetric network DDoS should remain outside direct coverage unless activity can be tied to HTTP/2 protocol handling, request cancellation, header processing, stream behavior, or application-layer resource exhaustion.
· General cloud, Kubernetes, or deployment vulnerabilities should remain outside direct coverage unless activity can be tied back to affected HTTP/2-facing infrastructure through source, route, protocol, workload, timing, identity, or incident-response evidence.
· Rust h2 CONTINUATION Flood advisory coverage is relevant as a related non-CVE advisory where it produces the same behavior chain, but it is not counted in the CVE total unless a CVE identifier is assigned.
Direct Coverage Conditions
Direct coverage applies when proof-of-concept or exploit activity produces one or more of the following behaviors:
· Rapid HTTP/2 stream resets or request cancellation.
· High reset-to-completed-request ratio.
· High request-cancellation ratio.
· Excessive HEADERS or CONTINUATION-frame behavior.
· Incomplete header completion or delayed END_HEADERS behavior.
· Header-limit, frame-limit, malformed-header, or protocol-error concentration.
· Request rejection linked to HTTP/2 protocol behavior.
· Memory growth, worker exhaustion, CPU pressure, queue growth, event-loop delay, or file-descriptor pressure on HTTP/2-facing infrastructure.
· Process restart, service restart, container restart, pod eviction, node pressure, or out-of-memory behavior during abnormal HTTP/2 activity.
· Gateway errors, upstream timeouts, target-health degradation, origin withdrawal, backend retry expansion, autoscaling surge, or route-level latency during abnormal HTTP/2 activity.
· User-facing availability loss affecting customer portals, authentication paths, APIs, payment workflows, SaaS front ends, regulated-service portals, or other business-critical web services.
· Defensive-control activation involving WAF rules, CDN protections, stream limits, header limits, connection limits, rate limits, circuit breakers, origin shielding, traffic shaping, or temporary HTTP/2 exposure reduction.
· Conditional post-event host, identity, cloud, Kubernetes, or deployment-control-plane activity tied to affected HTTP/2 infrastructure.
Coverage With Adaptation Conditions
Coverage with adaptation applies when activity uses a novel exploit mechanism, altered HTTP/2 frame pattern, modified stream behavior, different header-processing path, changed request cadence, distributed source infrastructure, proxy-aware routing, CDN-aware routing, gateway-specific behavior, ingress-specific behavior, service-mesh behavior, or implementation-specific weakness but still creates HTTP/2 protocol anomalies, source anomalies, resource pressure, edge-service instability, downstream service degradation, mitigation activation, or customer-facing availability impact.
Non-Coverage Conditions
Non-coverage applies when activity does not create observable HTTP/2, source, resource, edge-service, application, cloud, Kubernetes, mitigation, or downstream differences in available telemetry. This includes scenarios where:
· The activity does not interact with HTTP/2-enabled service paths.
· The activity affects only unrelated application features without protocol-resource impact.
· The activity remains limited to scanning, version exposure, patch-state exposure, or vulnerability inventory without exploit-attempt behavior.
· The activity affects only network volume without HTTP/2 protocol-resource behavior.
· The activity produces application degradation that cannot be linked to HTTP/2 behavior.
· Required HTTP/2 logs, proxy logs, WAF logs, CDN logs, load-balancer logs, API-gateway logs, ingress logs, service-mesh telemetry, resource telemetry, cloud logs, Kubernetes logs, application telemetry, network telemetry, change-control records, or SIEM telemetry are unavailable.
· Source hosts, routes, listeners, origins, edge nodes, services, pods, timestamps, protocol fields, client fingerprints, resource events, or downstream service events cannot be joined reliably.
· Activity is better explained by approved load testing, resilience testing, performance testing, synthetic monitoring, vulnerability scanning, deployments, failovers, CDN changes, WAF changes, ingress updates, service-mesh updates, autoscaling, maintenance, security testing, or incident response.
Current Coverage Count
Current behavior-led coverage directly supports 13 associated CVEs where the documented behavior aligns with HTTP/2 request cancellation, stream reset behavior, header processing, CONTINUATION-frame handling, memory exhaustion, CPU exhaustion, gateway instability, resource pressure, or application-layer denial-of-service impact. These CVEs are listed individually under Direct Coverage above to preserve section clarity and avoid duplicating the coverage list.
Related non-CVE advisories, including Rust h2 CONTINUATION Flood behavior, are covered behaviorally when they produce the same signal chain but are not included in the CVE count unless a CVE identifier is assigned.
Coverage Qualification
Coverage is strong for behaviorally visible HTTP/2 resource-exhaustion activity and weaker for silent implementation weaknesses that do not produce observable protocol anomalies, resource pressure, edge-service instability, service degradation, or mitigation activity in available telemetry. The report should not claim universal exploit detection, universal HTTP/2 implementation coverage, universal DDoS coverage, universal CVE coverage, or standalone attribution. Detection confidence depends on telemetry completeness, field mapping, local baselines, route inventory, asset inventory, HTTP/2 protocol visibility, resource telemetry, change-control records, false-positive testing, query performance testing, and SOC triage readiness.
Zero-Day Coverage Interpretation
The purpose of this S39 coverage model is to show that the detection strategy is not limited to the known exploit mechanics of the listed CVEs. Future zero-day or proof-of-concept activity affecting HTTP/2 header processing, stream lifecycle behavior, CONTINUATION-frame handling, request cancellation, frame limits, header limits, protocol parsing, gateway stability, or application-delivery behavior should still be detectable when it produces the same operational behaviors: abnormal HTTP/2 protocol activity, suspicious source behavior, resource pressure, edge-service instability, defensive-control activation, downstream service degradation, cloud or Kubernetes scaling pressure, or customer-facing availability impact. The model should not be presented as universal zero-day prevention; it is behavior-led coverage for zero-day activity that becomes visible through the HTTP/2-to-resource-to-service chain.
Executive Exposure Statement
The organization’s economic exposure is highest when HTTP/2 header abuse or memory exhaustion creates uncertainty around whether customer-facing application delivery remained reliable. The strategic risk is not only a malformed request, traffic spike, or one affected implementation; it is the possibility that attackers can abuse normal protocol handling to degrade the infrastructure that supports revenue, customer access, digital transactions, regulated-service continuity, and business-critical APIs.
S40 — References
Vendor / Platform Documentation
· CISA — HTTP/2 Rapid Reset Vulnerability, CVE-2023-44487 — hxxps://www[.]cisa[.]gov/news-events/alerts/2023/10/10/http2-rapid-reset-vulnerability-cve-2023-44487
· CERT/CC — VU#421644: HTTP/2 CONTINUATION Frames Can Be Utilized for DoS Attacks — hxxps://kb[.]cert[.]org/vuls/id/421644
· Red Hat — HTTP/2 Rapid Reset, CVE-2023-44487 and CVE-2023-39325 — hxxps://access[.]redhat[.]com/security/vulnerabilities/RHSB-2023-003
· Apache Tomcat Security — hxxps://tomcat[.]apache[.]org/security[.]html
· Apache HTTP Server Vulnerabilities — hxxps://httpd[.]apache[.]org/security/vulnerabilities_24[.]html
· Apache Traffic Server Security Advisories — hxxps://trafficserver[.]apache[.]org/security/
· Envoy Security Advisories — hxxps://github[.]com/envoyproxy/envoy/security/advisories
· Node.js Security Releases — hxxps://nodejs[.]org/en/blog/vulnerability/
· Go Vulnerability Database — hxxps://pkg[.]go[.]dev/vuln/
· nghttp2 Security Advisory GHSA — hxxps://github[.]com/nghttp2/nghttp2/security/advisories
· IBM WebSphere Application Server Liberty Security Bulletin, CVE-2024-27268 — hxxps://www[.]ibm[.]com/support/pages/security-bulletin-ibm-websphere-application-server-liberty-vulnerable-denial-service-cve-2024-27268
· RustSec Advisory Database — hxxps://rustsec[.]org/advisories/
Threat Technique Framework
· MITRE ATT&CK — Enterprise Matrix / Techniques Catalog — hxxps://attack[.]mitre[.]org/
Security Vendor Analysis
· CISA — Known Exploited Vulnerabilities Catalog — hxxps://www[.]cisa[.]gov/known-exploited-vulnerabilities-catalog
· NVD — Vulnerability Database / CVE Catalog — hxxps://nvd[.]nist[.]gov/vuln
· CVE Program — CVE Records — hxxps://www[.]cve[.]org/CVERecord
· Checkmarx — HTTP/2 CONTINUATION Flood Vulnerability Overview — hxxps://checkmarx[.]com/blog/what-you-should-know-http-2-continuation-flood-vulnerability/
Threat Tradecraft and Intrusion Patterns
· Qualys — CVE-2023-44487: HTTP/2 Rapid Reset Attack — hxxps://blog[.]qualys[.]com/vulnerabilities-threat-research/2023/10/10/cve-2023-44487-http-2-rapid-reset-attack